In the ECG performance standard IEC60601-2-47 has disclosed to evaluate HRV algorithm performance using artificial ECG signal. In subclause 201.12.1.101.2.3.3.2, there are two methods (analogue and digital). For fully compliance standard, it is better to test both methods. Below is the clear explanation for two methods.
Analogue Test
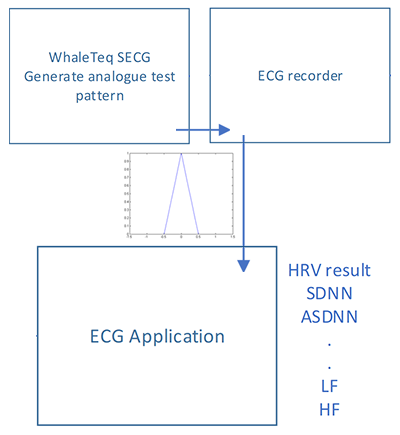
This test uses one test pattern that intended to be applied from ECG recorder to algorithm. The test pattern (name: test pattern 1) is a triangular pulse with 1mV amplitude, 100ms pulse width and 1Hz (60BPM). The test signal is reproduced through amplifier, analogue to digital component, filtering , QRS detector and HRV algorithm shown as below figure.

It requires to perform HRV index analysis for totally three times. The one HRV calculation period shall be at least five minutes. The noise floor can be measured after all the three tests. The noise floor reveals contributions from sampling, phase lock loops, arithmetic precision and perhaps other effects. The table 1 is an example of HRV test result and noise floor calculation result. We suggest you using the same format to demonstrate the performance.
| HRV index | Trial 1 | Trial 2 | Trial 3 | Noise floor |
| SDNN | 4.7ms | 4.8ms | 4.1ms | 4.8ms |
| ASDNN | 4.1ms | 3.9ms | 4.0ms | 4.1ms |
| SDANN | 0.2ms | 0.4ms | 0.5ms | 0.5ms |
| RMSSD | 5.6ms | 6.1ms | 5.7ms | 6.1ms |
| pNN50 | 0% | 0% | 0% | 0% |
| TINN | 24ms | 24ms | 16ms | 24ms |
| VLF | 0.04ms2 | 0.04ms2 | 0.04ms2 | 0.04ms2 |
| LF | 0.13ms2 | 0.13ms2 | 0.13ms2 | 0.13ms2 |
| HF | 1.3ms2 | 1.3ms2 | 1.25ms2 | 1.3ms2 |
Table 1. Analogue test result table
Digital Test
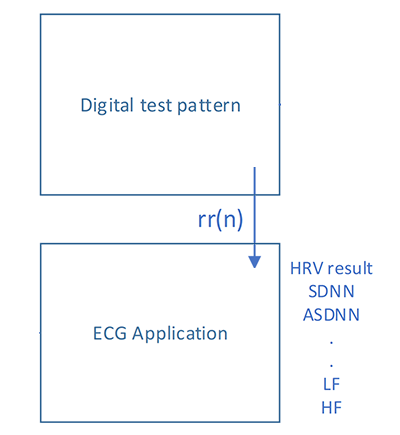
This test uses four test patterns that intended to apply into HRV algorithm as shown in the below figure. These four test patterns (name: test pattern 2 to 5) are beat to beat sequence.

The test patterns are sinusoidal pattern as a sequence of NN interval that obeys the following rules. The variable parameters shown on table 2.
rr(k) = rravg + rrdev * sin(2*π*hrvfreq*T(k))
T(k+1) = T(k) + rr(k), T(0) = 0.0
| Test pattern | rravg | rrdev | hrvfreq | hrvperiod |
| 2 | 0.8 | 0.035 | 0.25 | 4s |
| 3 | 1 | 0.07 | 0.1 | 10s |
| 4 | 3 | 0.28 | 0.033333 | 30s |
| 5 | 1.5 | 0.14 | 0.000278 | 1h |
Table 2. Digital test pattern parameters
Construct enough duration of each test pattern to satisfy each HRV period required. For each test pattern gives an expected value for each HRV index shown table 3.
| HRV index | Test pattern 2 | Test pattern 3 | Test pattern 4 | Test pattern 5 |
| SDNN | 24.75 | 49.5 | 197.99 | 98.99 |
| ASDNN | 0 | 0 | 0 | 97.87 |
| SDANN | 24.75 | 49.5 | 197.99 | 14 |
| RMSSD | 29.77 | 31.25 | 125.87 | 0.28 |
| pNN50 | 0 | 0 | 87 | 0 |
| VLF | 0 | 0 | 39200 | 0 |
| LF | 0 | 2450 | 0 | 0 |
| HF | 612.5 | 0 | 0 | 0 |
Table 3. The expected HRV index value for each test patterns
Please process and fill in table 4 for each HRV index and compare the measured HRV index to the expected for each test pattern.
| HRV index | Test pattern 2 | Test pattern 3 | Test pattern 4 | Test pattern 5 |
| SDNN | ||||
| ASDNN | ||||
| SDANN | ||||
| RMSSD | ||||
| pNN50 | ||||
| VLF | ||||
| LF | ||||
| HF |
Table 4. The measured HRV index value for each test patterns