Introduction
This article introduces methods for testing the ECG and PPG performance of wearable devices, and uses a case study to illustrate how WhaleTeq test equipment can assist users in verifying performance during the development, quality control, and production.
Currently, the primary physiological signals measured by wearable devices are ECG (electrocardiogram) and PPG (Photoplethysmography) signals. To verify the accuracy of wearable devices, ECG function is generally tested in accordance with IEC 60601-2-47 (Particular requirements for the basic safety and essential performance of ambulatory electrocardiographic systems). PPG signals are mainly used to calculate Heart Rate (HR) and oxygen saturation (SpO2). However, there is currently no specific standard that defines how to perform performance testing for PPG signals.
To help improve the accuracy of physiological signal measurements in wearable devices, WhaleTeq's AECG100 multifunctional performance tester, when paired with a PPG module, is capable of simulating single-channel ECG signals and PPG signals. It is suitable for testing ECG performance, PPG-based HR and SpO2, as well as PWTT (Pulse Wave Transit Time), which combines ECG and PPG signals.
ECG performance can be tested using the AECG100 alone. The tester is equipped with four electrodes—RA (R), LA (L), RL (N1), and RL (N2)—which can generate simulated signals defined in the IEC 60601-2-47 to test ECG algorithms and electrical performance. The test items defined in this standard mainly include amplitude accuracy, linearity and dynamic range, input impedance, frequency response, CMRR (Common Mode Rejection Ratio), internal noise level, and more.
PPG performance testing requires the AECG100 in combination with a PPG module. The PPG module is available in three types:
• Reflectance single-wavelength (green light)
• Reflectance dual-wavelength (red and infrared)
• Transmittance dual-wavelength (red and infrared)
The reflectance single-wavelength module provides green-light PPG signals for heart rate simulation, while the dual-wavelength modules provide reflectance and transmittance SpO2 simulation signals.
Since there is currently no standardized procedure for PPG performance testing, step-by-step validation requires adjusting parameters such as DC, AC, and heart rate with the PPG module. These parameters simulate variations in skin tone, arterial volume, oxygen saturation, and pulse frequency. By modifying these settings, various test scenarios can be flexibly created.
At the same time, by using the AECG100 together with the PPG module, PWTT parameters can also be configured, enabling wearable devices to optimize algorithms for blood pressure measurement and arterial stiffness assessment.
Device Under Test Example: ADI Evaluation Kit MAXRFFDES104
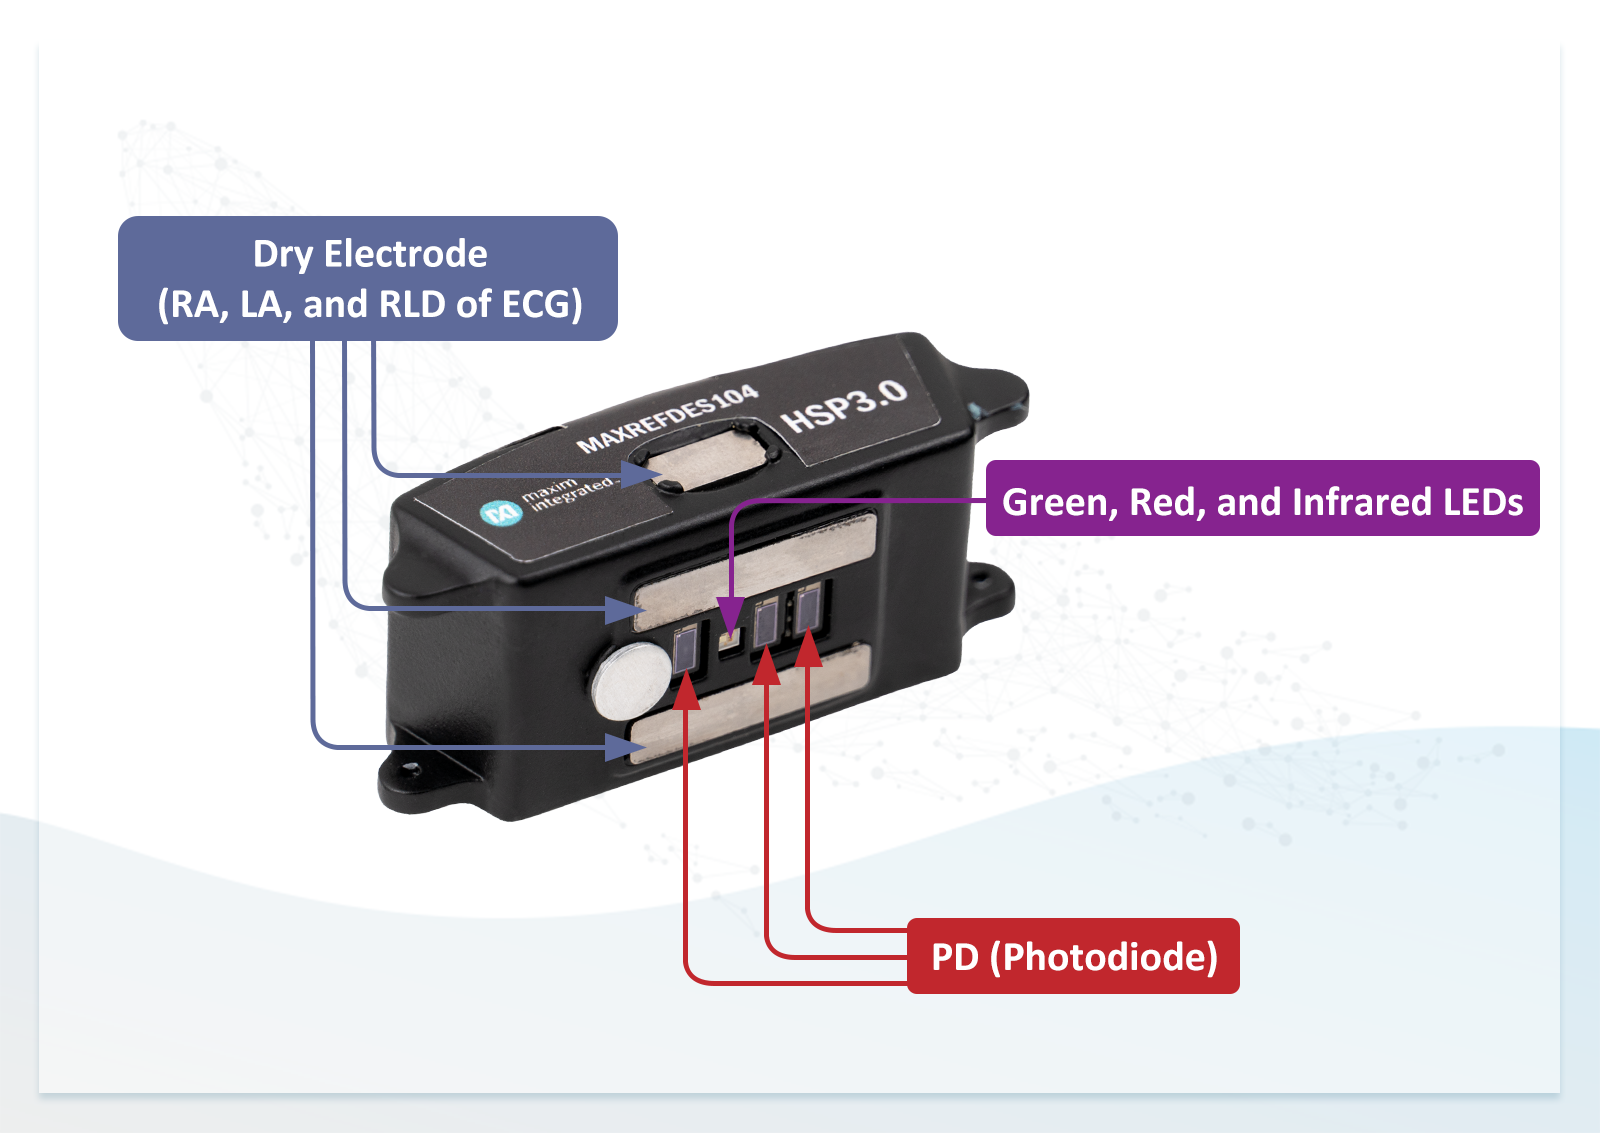
The MAXRFFDES104 developed by ADI (Figure 1) is a smartwatch evaluation kit that integrates ECG, PPG, HR, and SpO2 functions.
Its ECG function uses dry electrodes to acquire RA, LA, and RLD signals from the human body, which are then processed, stored, and displayed as ECG waveforms. The PPG function consists of green, red, and infrared LEDs along with three photodiodes (PDs) used to emit and receive reflected or transmitted light. The captured optical signals are processed to calculate HR and SpO2 values.
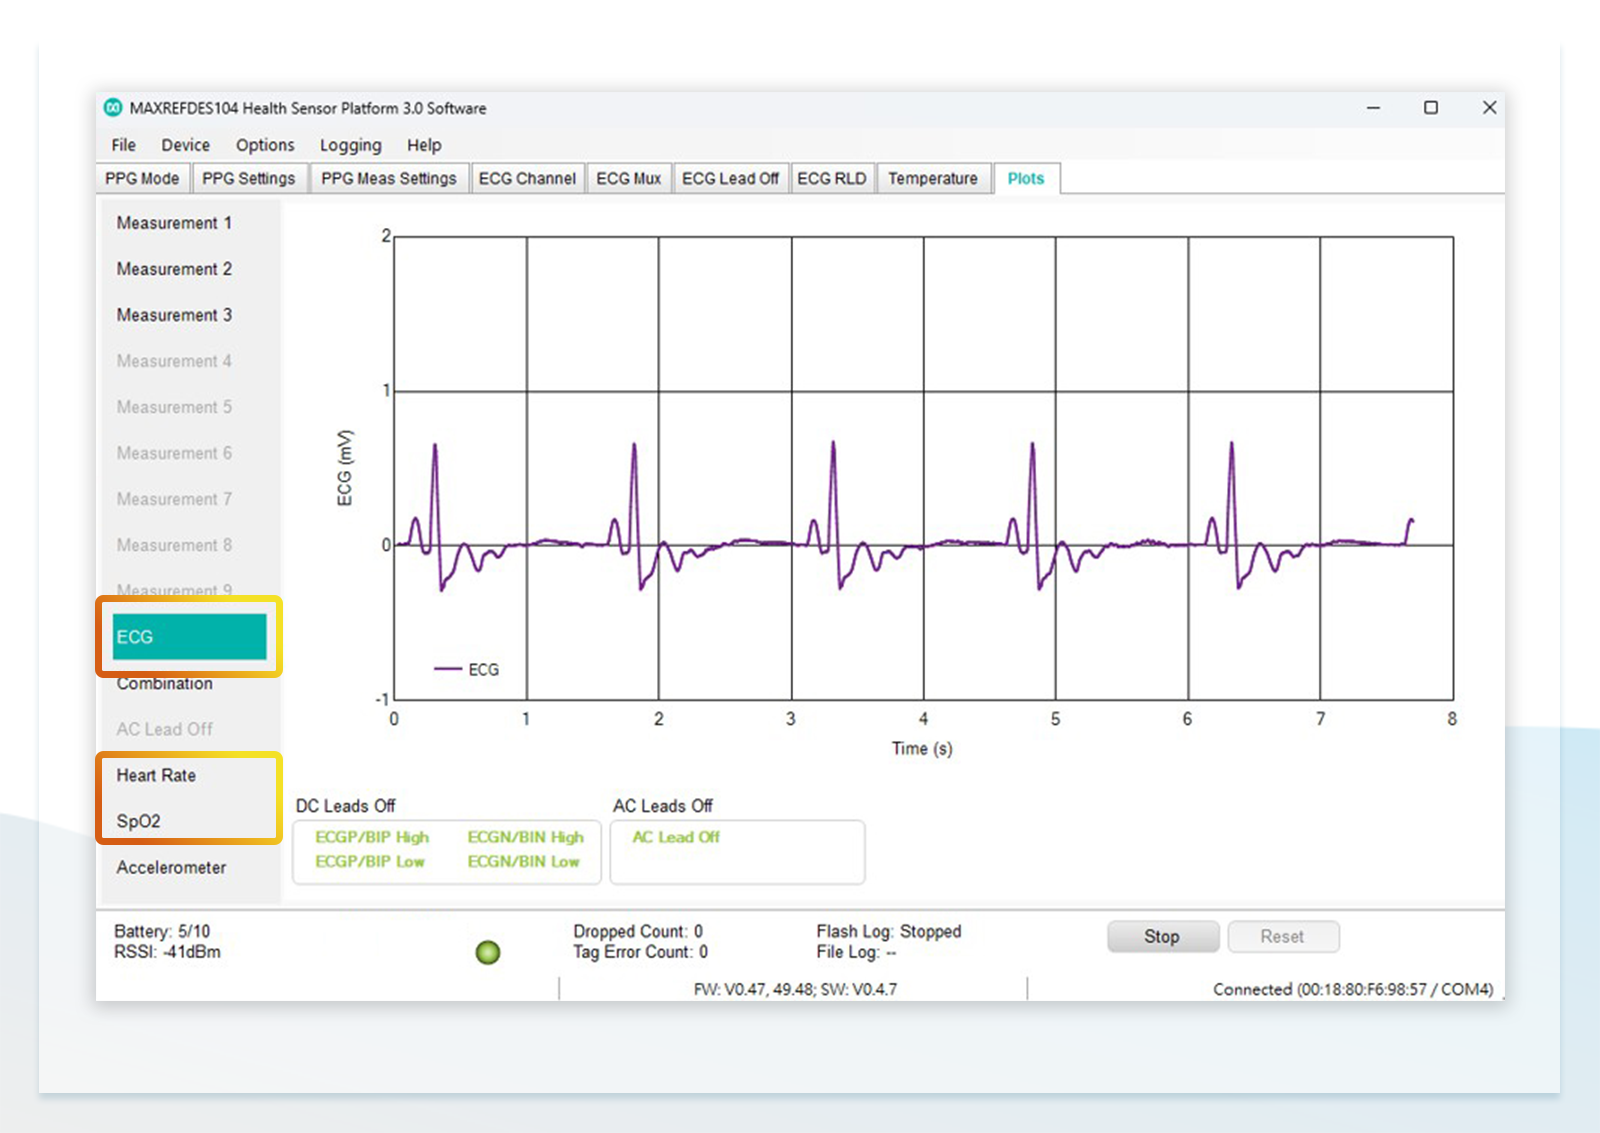
Figure 2 shows the control software interface of the ADI evaluation kit. This software allows users to configure ECG and PPG acquisition parameters and display the captured raw waveforms. After saving, HR and SpO2 values can be calculated (the figure shows an ECG waveform).
【Figure 1】ADI Evaluation Kit MAXRFFDES104
ECG Performance Testing of Wearable Devices
According to IEC 60601-2-47:2012, ECG testing is divided into two main categories:
1. Accuracy
Using five standard databases with reference annotations to evaluate the accuracy of the device's algorithm.
2. Protection Against Hazardous Output
Defines test methods and criteria for ECG hardware performance, including the following 12 items:
201.12.4.4.101 Linearity and dynamic range
201.12.4.4.102 Input impedance
201.12.4.4.103 Common mode rejection
201.12.4.4.104 GAIN accuracy
201.12.4.4.105 GAIN stability
201.12.4.4.106 System noise
201.12.4.4.107 Multichannel crosstalk
201.12.4.4.108 Frequency response
201.12.4.4.109 Function in the presence of pacemaker pulses
201.12.4.4.110 Timing accuracy
201.12.4.4.111 GAIN settings and switching
201.12.4.4.112 Temporal alignment
Among these, except for ''201.12.4.4.103 Common mode rejection'' and ''201.12.4.4.106 System noise'', which require dedicated test instruments, and ''201.12.4.4.111 GAIN settings and switching'', which does not require testing, the remaining nine items can be tested using the AECG100.
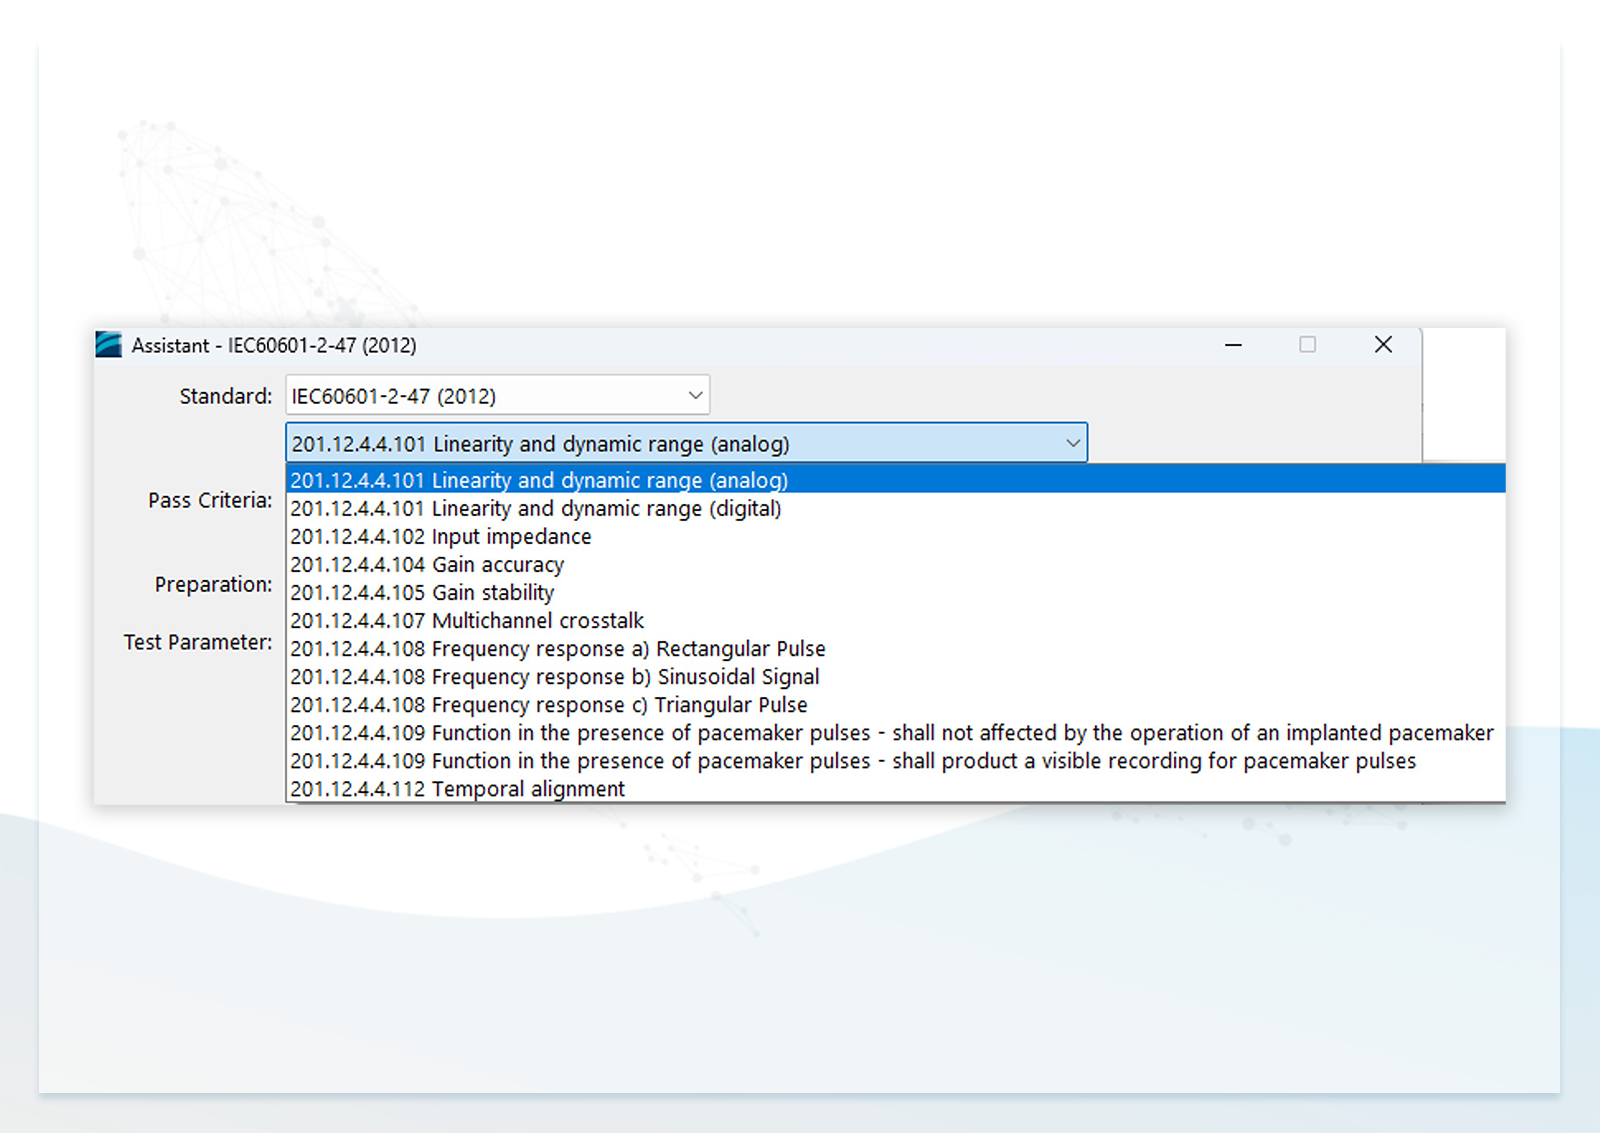
Users may either manually configure parameters according to the standard or use the built-in standard assistant software (Figure 3) in AECG100, which automatically sets parameters for each test item, saving time and reducing the need to interpret the standard.
【Figure 3】Built-in IEC 60601-2-47 Sandard Assistant Software in AECG100
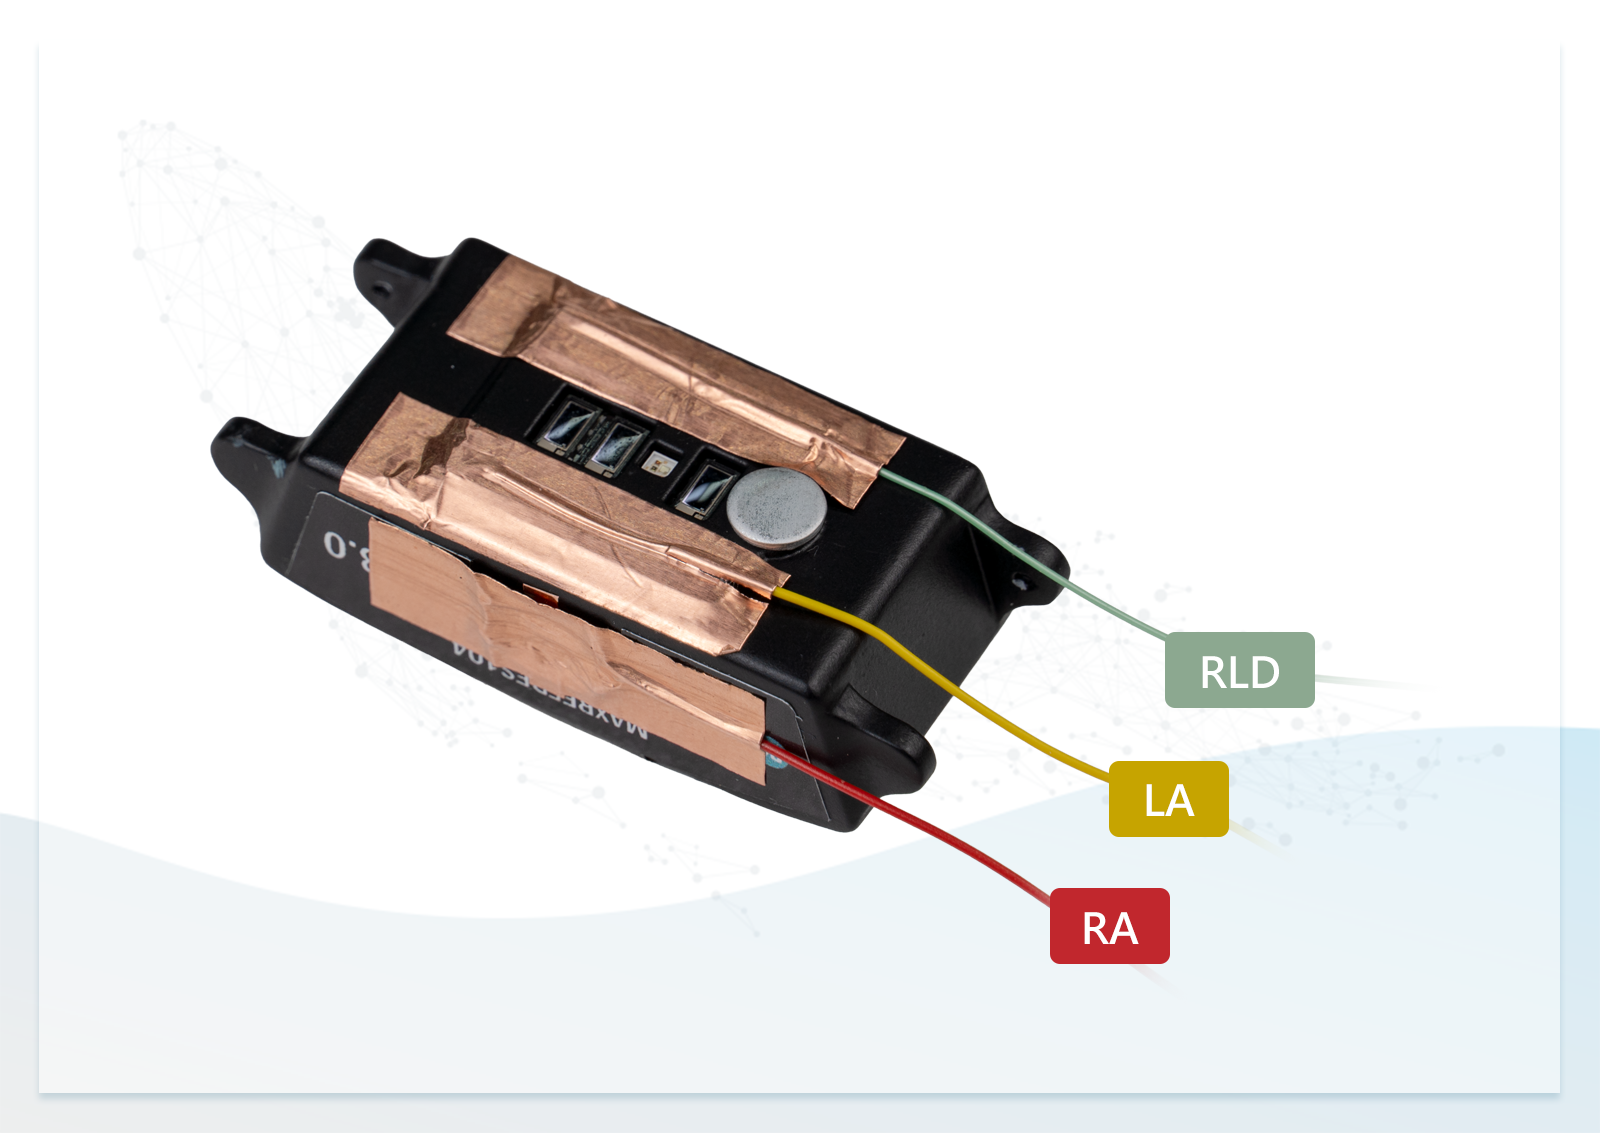
Since wearable devices often use dry electrodes without cables, connecting them to the AECG100 can be challenging.
As shown in Figure 4, copper foil tape can be used to attach wires to the dry electrodes and connect them to the RA, LA, RL electrodes on AECG100. This method is quick and convenient for development-stage testing, but not suitable for long-term use due to poor adhesion. For production environments, pogo pins or conductive foam with dedicated fixtures are recommended for stable, long-duration testing.
【Figure 4】Use Copper Foil Tape to Attach 3 Wires to the Dry Electrodes for Testing
PPG Performance Testing of Wearable Devices
1. Operational Principle of Reflectance PPG Wearables
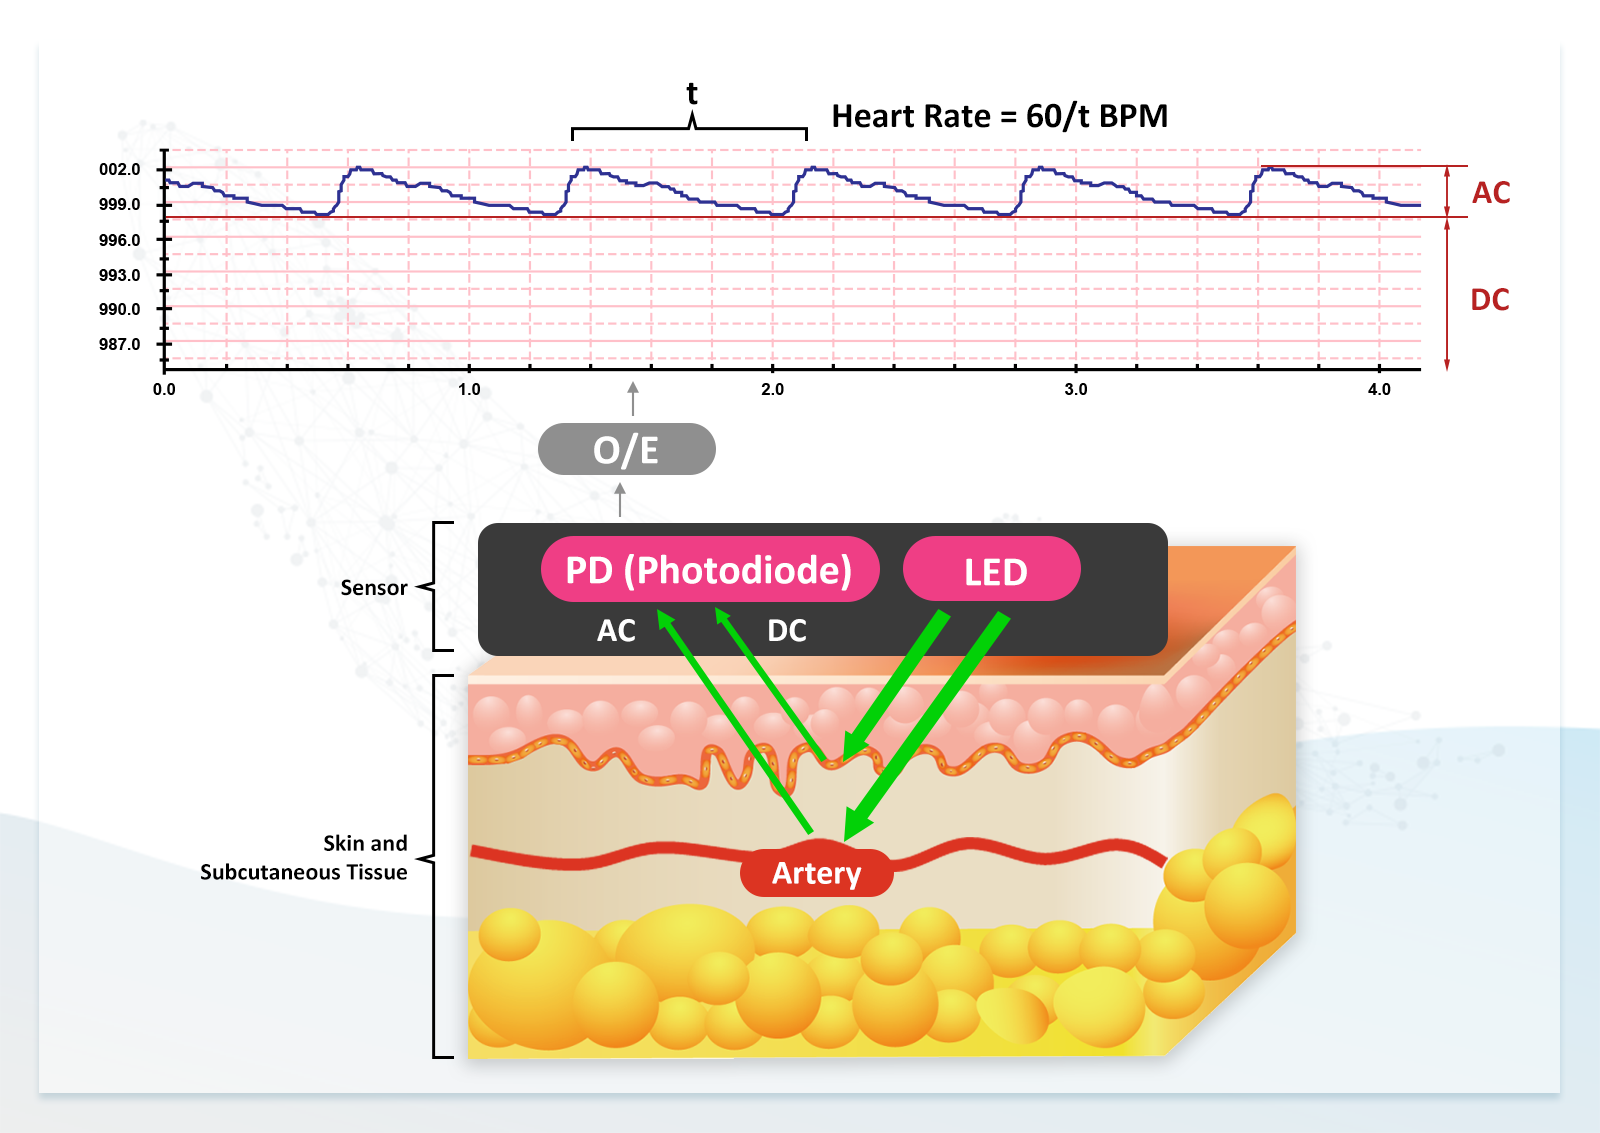
PPG (Photoplethysmography) is a technique that uses variations in the intensity of reflected or transmitted light—typically from a single-wavelength LED (commonly green light)—to measure changes in the volume of human tissue, including muscle and arteries. Based on the frequency of these arterial volume changes, heart rate can be calculated.
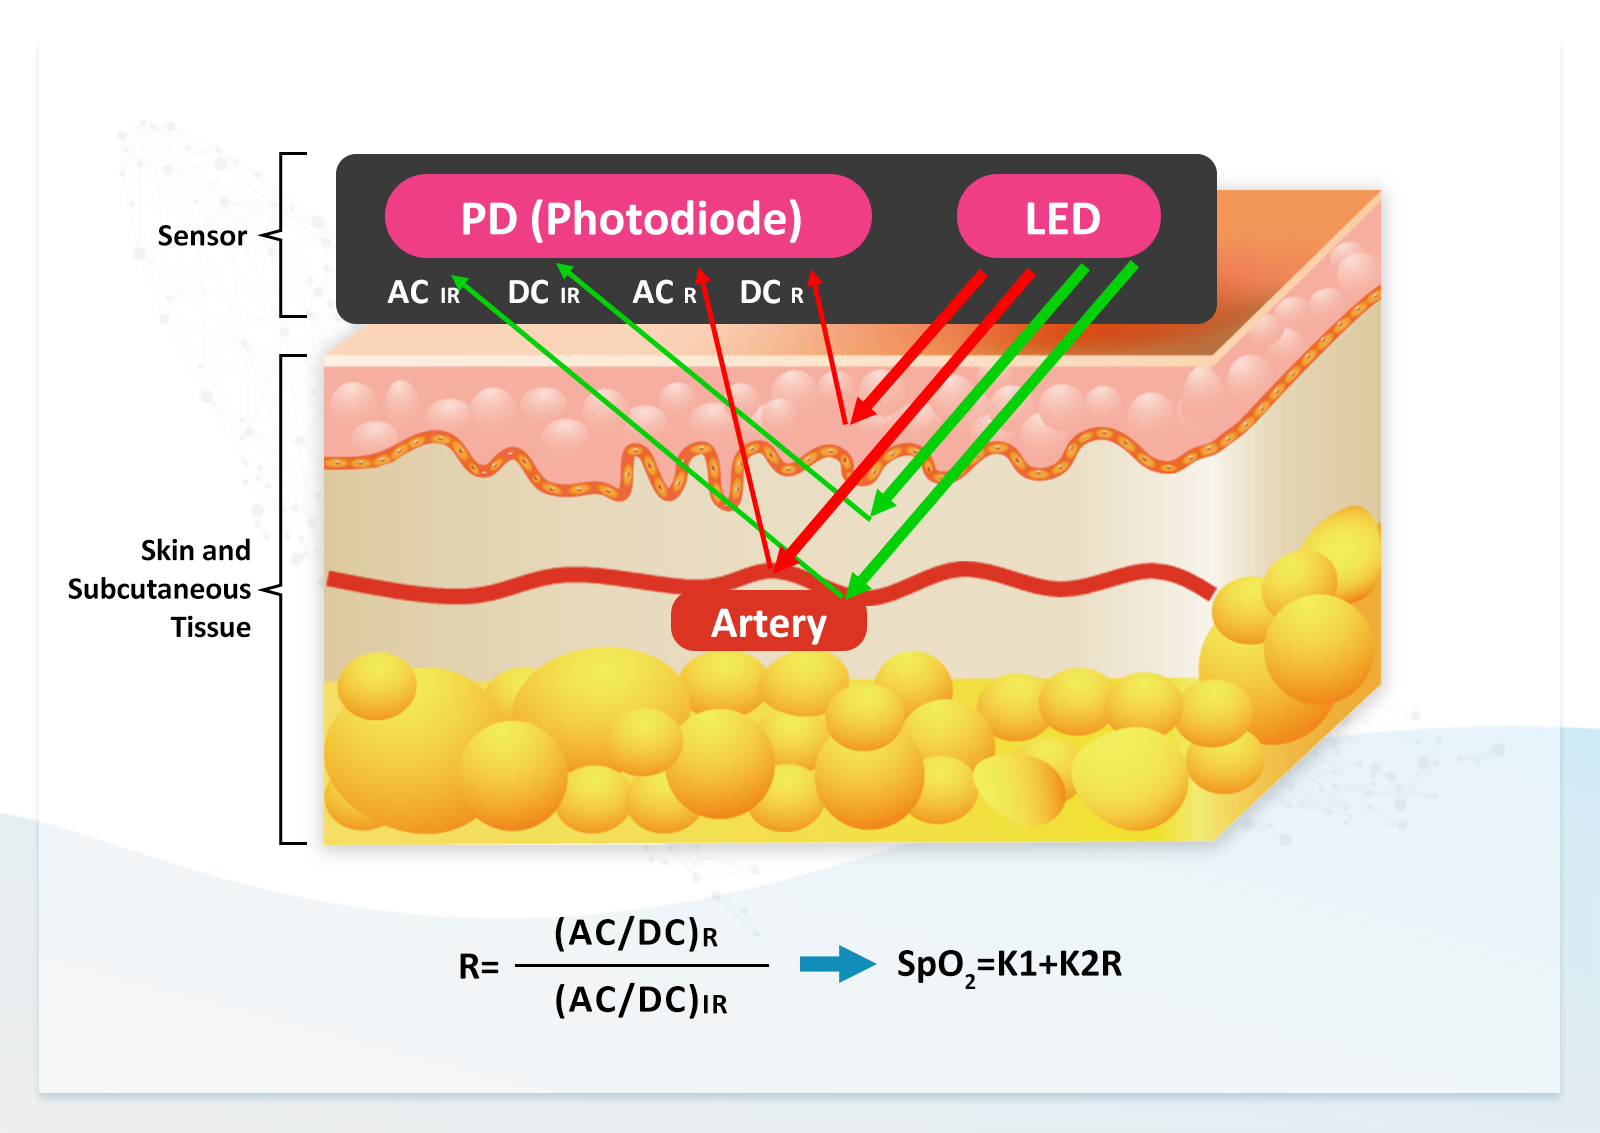
In addition to changes in arterial volume, when red and infrared light are used, the variation in reflected or transmitted light intensity at different blood oxygen saturation levels can be used to calculate the R value. By substituting this R value into an R curve equation, the blood oxygen saturation (SpO2) can be derived.
The operational principles of single-wavelength (green light) and dual-wavelength (red and infrared light) systems are described below.
Single-Wavelength (Green Light)
When single-wavelength (green) light is emitted into the subcutaneous tissue, under static conditions the tissue volume remains constant. As a result, the intensity of the reflected light is stable, which is converted into an electrical signal represented as the DC component.
The magnitude of the DC value is related to skin tone:
• Lighter skin reflects more light, resulting in a higher DC value
• Darker skin reflects less light, resulting in a lower DC value
Arteries, however, expand and contract due to cardiac pumping and blood return. These volume changes cause variations in the intensity of reflected light, which are converted into the AC component of the electrical signal. The frequency of the AC signal is then used to calculate heart rate.
In addition, the magnitude of the AC component is related to arterial elasticity:
• Better elasticity results in larger variations in reflected light and a higher AC value
• Poorer elasticity results in smaller variations and a lower AC value
【Figure 5】AC and DC components of reflected light under static conditions when single-wavelength (green) light is emitted into subcutaneous tissue
Dual-Wavelength (Red and Infrared Light)
When dual-wavelength (red and infrared) light is emitted into the subcutaneous tissue, reflected light is present under static conditions and can be converted into electrical signals consisting of both AC and DC components.
For red light:
• AC component: ACR
• DC component: DCR
For infrared light:
• AC component: ACIR
• DC component: DCIR
From these four parameters, the R value can be calculated as: R=(ACR/DCR)/(ACIR/DCIR).
By substituting the R value into an R curve equation, the SpO2 value can be determined.
The R curve can be expressed as a linear equation: SpO2=K1+K2R, where K1 and K2 are constants. According to the empirical linear calibration formula proposed by Webster (Webster, 2002), instantaneous SpO2 can be expressed as: SpO2=110-25R, which corresponds to K1=110 and K2=-25.
The R curve can also be expressed as a quadratic equation. Since the response curve of LEDs and PDs follow exponential functions, a quadratic equation can more accurately represent SpO2 values: SpO2=K1+K2R+K3R2, where K1, K2, and K3 are constants.
【Figure 6】 AC and DC components of reflected light under static conditions when dual-wavelength (red and infrared) light is emitted into subcutaneous tissue
2. Functions of the PPG Simulator (Multifunctional Performance Tester)
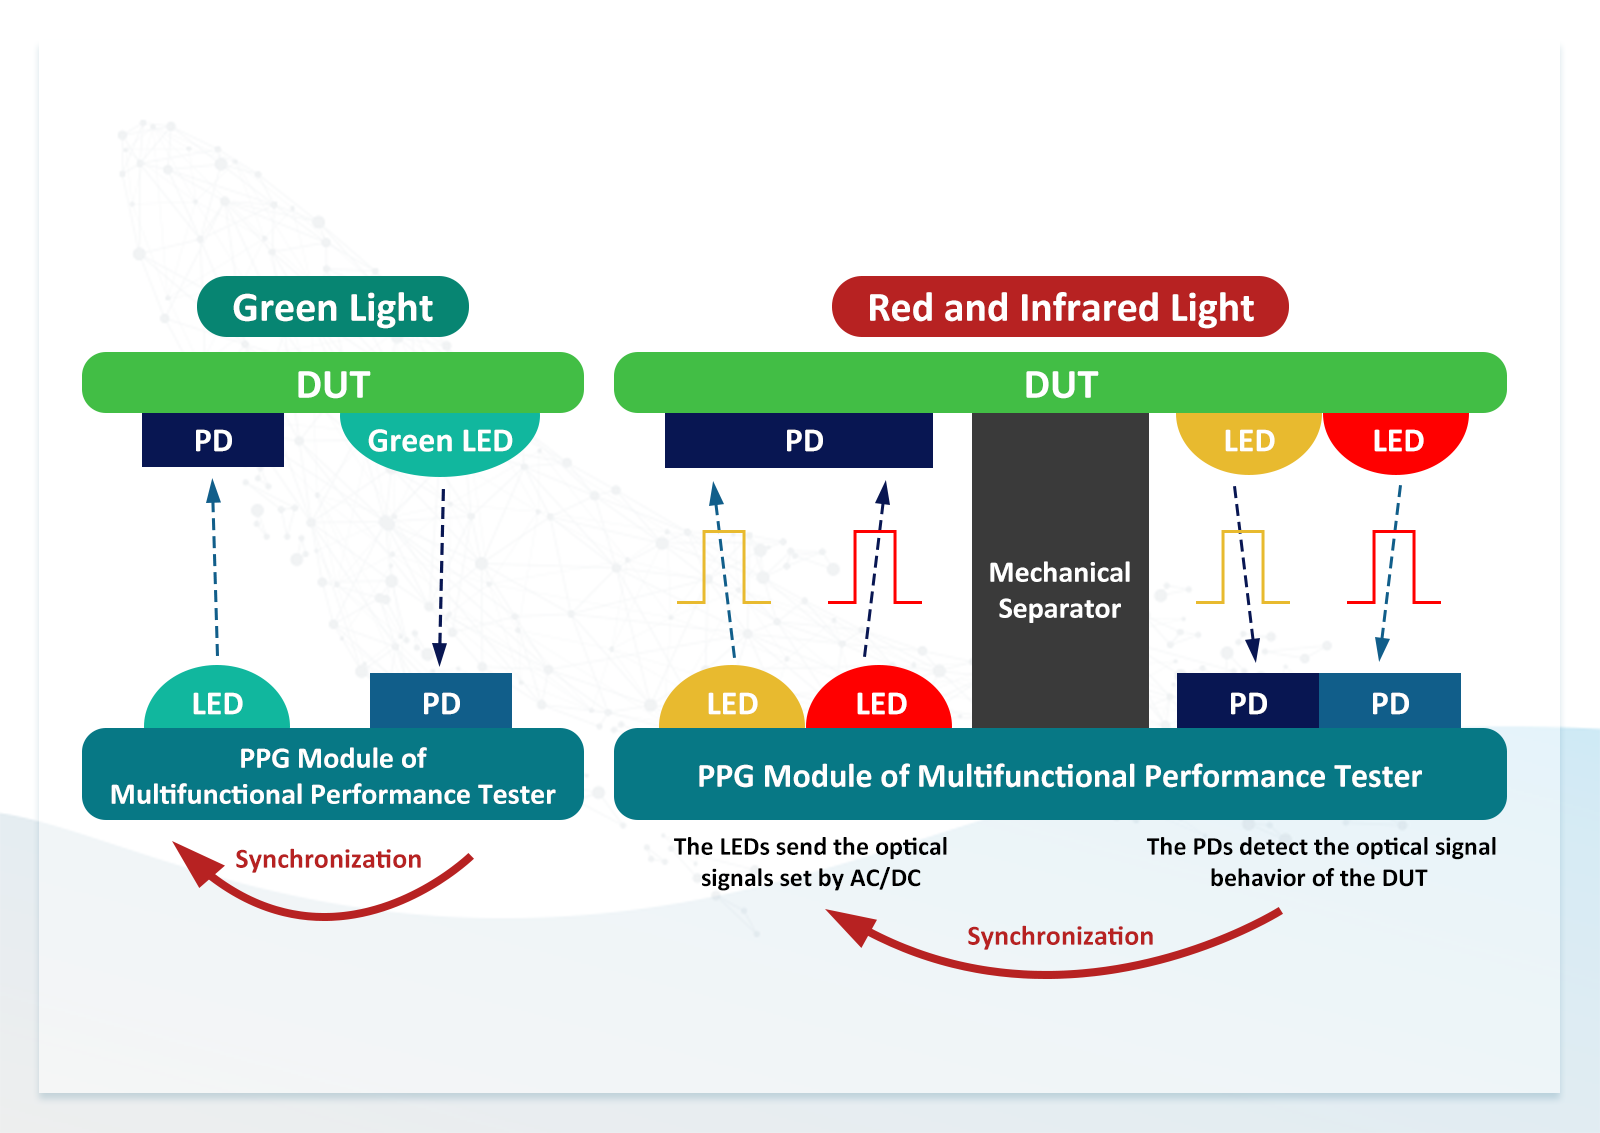
To simulate the reflected light from human skin (including both DC and AC components), the PPG simulator (multifunctional performance tester) provides two primary functions:
1. It uses its LEDs to synchronously reproduce the light emitted by the LEDs of the DUT, based on the optical signals detected by its PDs.
2. It allows adjustment of the DC light intensity emitted by its LEDs to simulate variations in reflected light corresponding to different skin tones. In addition, by adjusting the AC light intensity and frequency, it can simulate different levels of arterial elasticity and heart rate.
Figure 7 illustrates the operational principles of the green, red, and infrared simulators. When the DUT emits LED light, the simulator's PDs detect the signal, and its LEDs synchronously emit simulated reflected light back to the DUT's PDs.
For the red and infrared simulator, two PDs are used: one is dedicated to detecting infrared light, the other is a wideband PD. This configuration enables proper synchronization of the emission timing and sequence of red and infrared light.
After synchronizing the emission timing and sequence, the DC and AC parameters of the simulator's LED output can be adjusted, including HR, DCR, ACR, DCIR, and ACIR. From these parameters, the perfusion index (PI) for red and infrared light—PI (R) and PI (IR)—as well as the R value can be calculated. By substituting the R value into a predefined R curve, different SpO2 and HR settings can be configured to evaluate the accuracy and measurement range of the DUT.
To simulate variations in heart rate, skin tone, arterial elasticity, and blood oxygen saturation, the simulator must provide a sufficiently wide parameter range. This ensures that the simulated signals can adequately represent different skin reflection conditions.
【Figure 7】Operational principles of the green, red, and infrared PPG simulators (multifunctional performance tester)
Testing the HR and SpO₂ Functions of the ADI Evaluation Kit MAXRFFDES104 Using the AECG100 with a PPG Module
Definition of a SpO2 Functional Tester in Standards
Currently, there is no specific standard that defines performance testing methods for PPG signals. However, according to ISO 80601-2-61:2018, any device that generates simulated signals to test pulse oximeter equipment is defined as a functional tester.
A suitable functional tester helps the responsible party verify whether a pulse oximeter device and its probe can operate according to the performance specifications defined by the manufacturer. However, it does not verify the accuracy of the measurement results.
To confirm the accuracy of SpO2 values, clinical calibration is required using CO-oximeters (blood gas analysis methods) or secondary-calibrated pulse oximeter devices.
A functional tester provides the pulse oximeter device with a signal corresponding to a predefined R value. The responsible party can then observe the SpO2 value displayed by the pulse oximeter and determine whether it matches the expected value for that specific device model.
If the functional tester manufacturer knows the R curve of a specific pulse oximeter, it can generate an accurate R value corresponding to a specific SpO2 level (e.g., 85%). Through this mechanism, the ability of the pulse oximeter to reproduce its internal calibration curve can be evaluated.
It is important to note that the SpO2 value displayed on the functional tester does not represent the actual accuracy of the pulse oximeter when measuring a human subject. The functional tester only evaluates the device's ability to reproduce its R curve. If the R curve itself is inaccurate, the measured SpO2 values may also be incorrect.
In summary, a SpO2 functional tester uses a predefined R-value signal to test pulse oximeter devices, verifying their functionality and evaluating their ability to reproduce the internally implemented calibration curve. Since this calibration curve is proportional to the R value, it is referred to as the R curve.
The ISO 80601-2-61:2018 primarily specifies clinical test methods and does not define detailed procedures for using a functional tester.
Therefore, the reflectance SpO2 functional testing method described below is based on the logic of the transmittance SpO2 testing method outlined in the standard. By using the AECG100 with a PPG module as a functional tester, users can verify the measurement range and stability of a pulse oximeter device before clinical testing. This helps avoid performing clinical tests without prior functional validation, which could otherwise lead to repeated recalibration, retesting, increased cost, and time.
1. Required Test Equipment
♦ AECG100 main unit, red and infrared PPG module, computer, and AECG100 software.
♦ MAXRFFDES104 wearable evaluation kit and its 3D fixture.
2. Overview of MAXRFFDES104 and Design of the 3D Fixture
♦ MAXRFFDES104 Health Sensor Wristband
The MAXRFFDES104 integrates high-sensitivity PPG, ECG, and temperature biosensors from Maxim, along with a Power Management IC (PMIC) and a Microcontroller Unit (MCU). It collects critical physiological signals and includes algorithms that compute cardiac health metrics and blood oxygen saturation based on sensor measurements.
♦ 3D Fixture
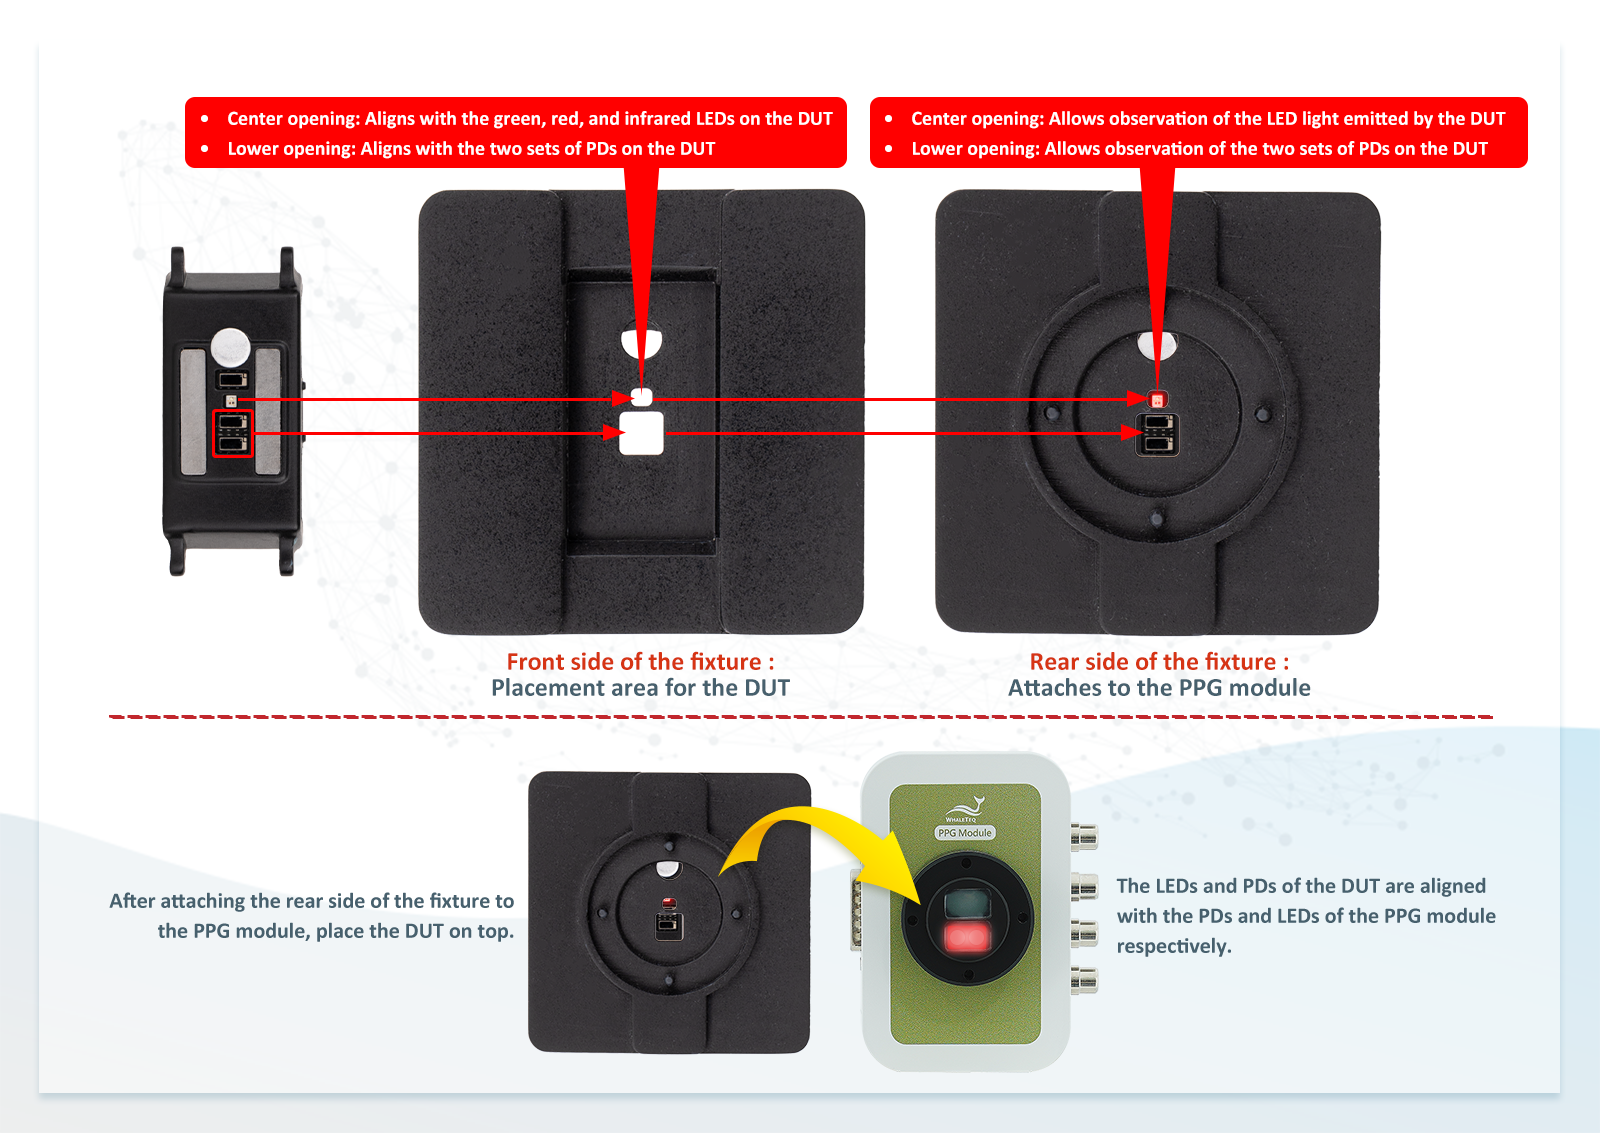
As shown in Figure 8, this custom fixture is designed to securely align the PPG module with the MAXRFFDES104 for SpO₂ testing.
Since only red and infrared LEDs are used during SpO₂ testing, the upper openings of the fixture are designed to align with the red and infrared light emitted by the DUT, while blocking green light to ensure accurate measurement. The lower openings are aligned with the DUT’s PDs.
After the fixture is attached to the base of the PPG module, the opposite side of the fixture aligns with the DUT’s PDs and LEDs (i.e., the PPG module LEDs align with the DUT PDs, and the PPG module PDs align with the DUT LEDs).
Once the fixture is secured to the PPG module and the module is connected to the AECG100 main unit, the system is ready for testing.
Note: The fixture design is customized according to the arrangement of LEDs and PDs on the DUT. For example, in the MAXRFFDES104, the LEDs and PDs are arranged side-by-side, and the fixture openings are designed accordingly.
If the LED and PD arrangement differs (e.g., arranged in a circular pattern), the fixture must be adapted to ensure proper alignment with the PPG module and to achieve accurate test results. For more details, please refer to the Customized Fixture FAQ or Smartwatch Performance Testing Package.
【Figure 8】3D fixture used to align the PPG module with the MAXRFFDES104 for SpO2 testing
3. SpO2 Test Procedure
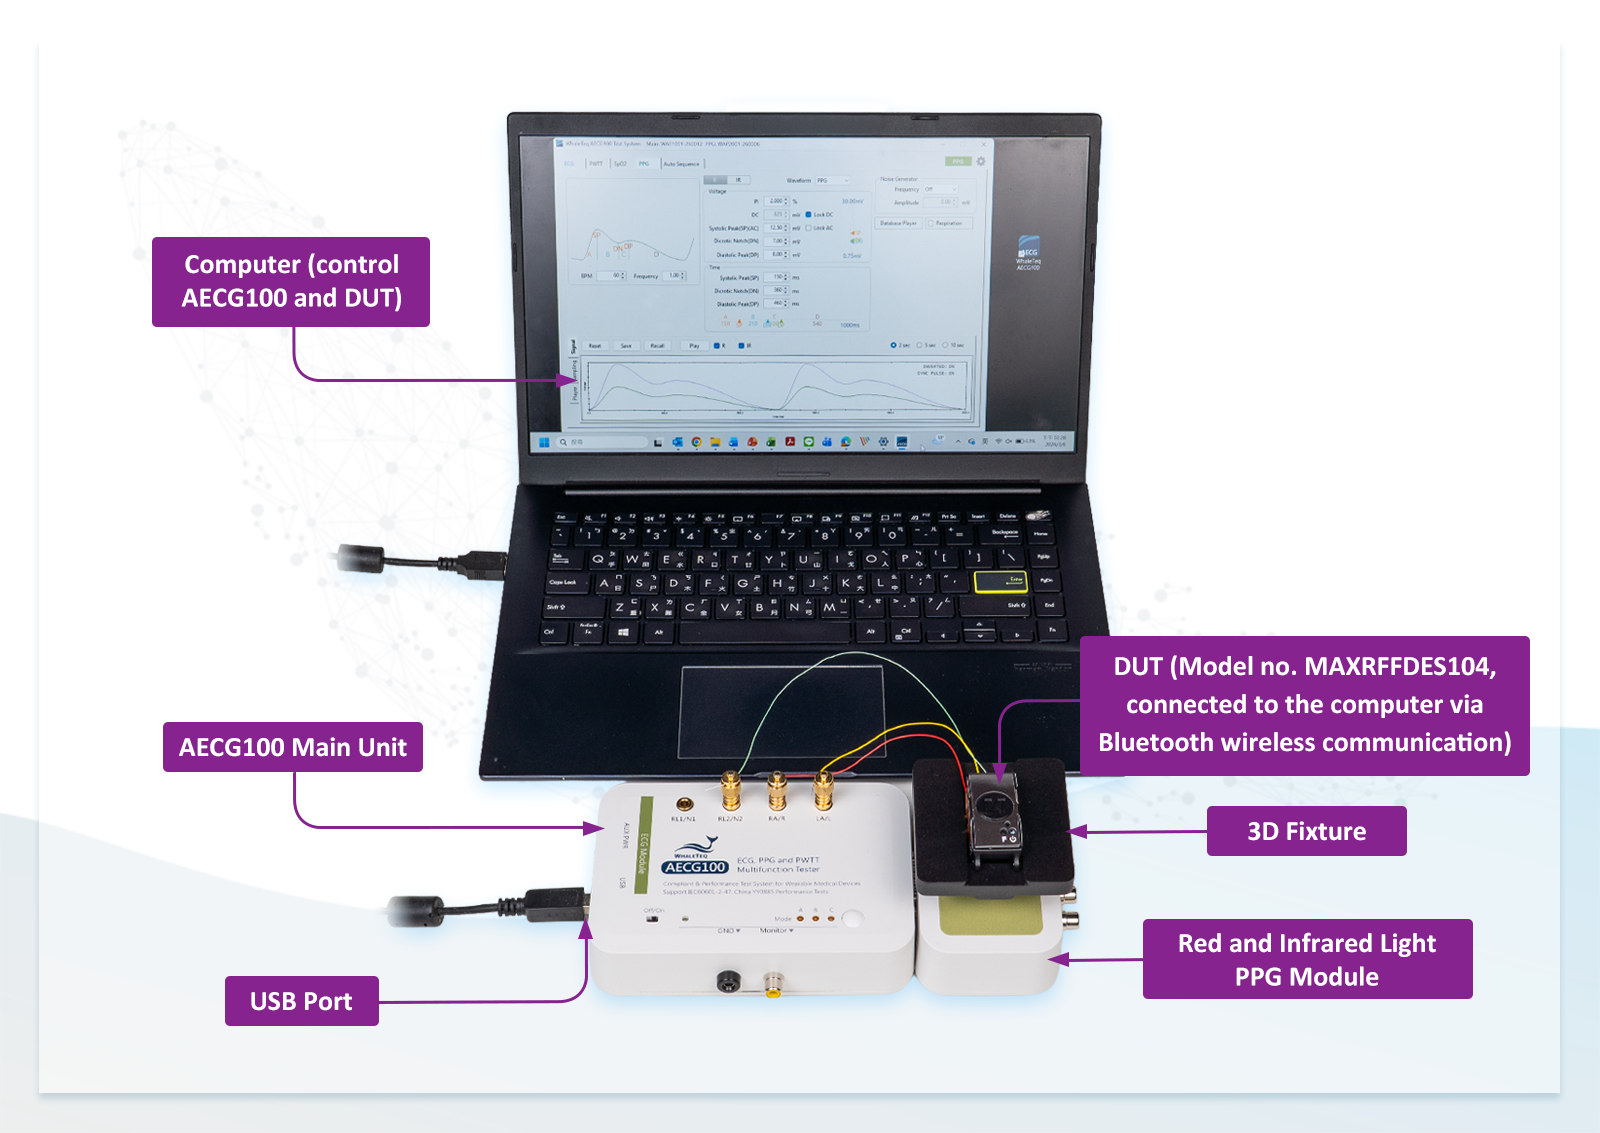
♦ Test Setup
As shown in Figure 9, this setup is used to test the SpO2 function of a reflectance wearable device. The DUT is the MAXRFFDES104. The computer controls the AECG100 via USB and the DUT via wireless Bluetooth communication. The DUT is attached to the PPG module using the 3D fixture.
【Figure 9】Test setup for evaluating the SpO2 function of a reflectance wearable device
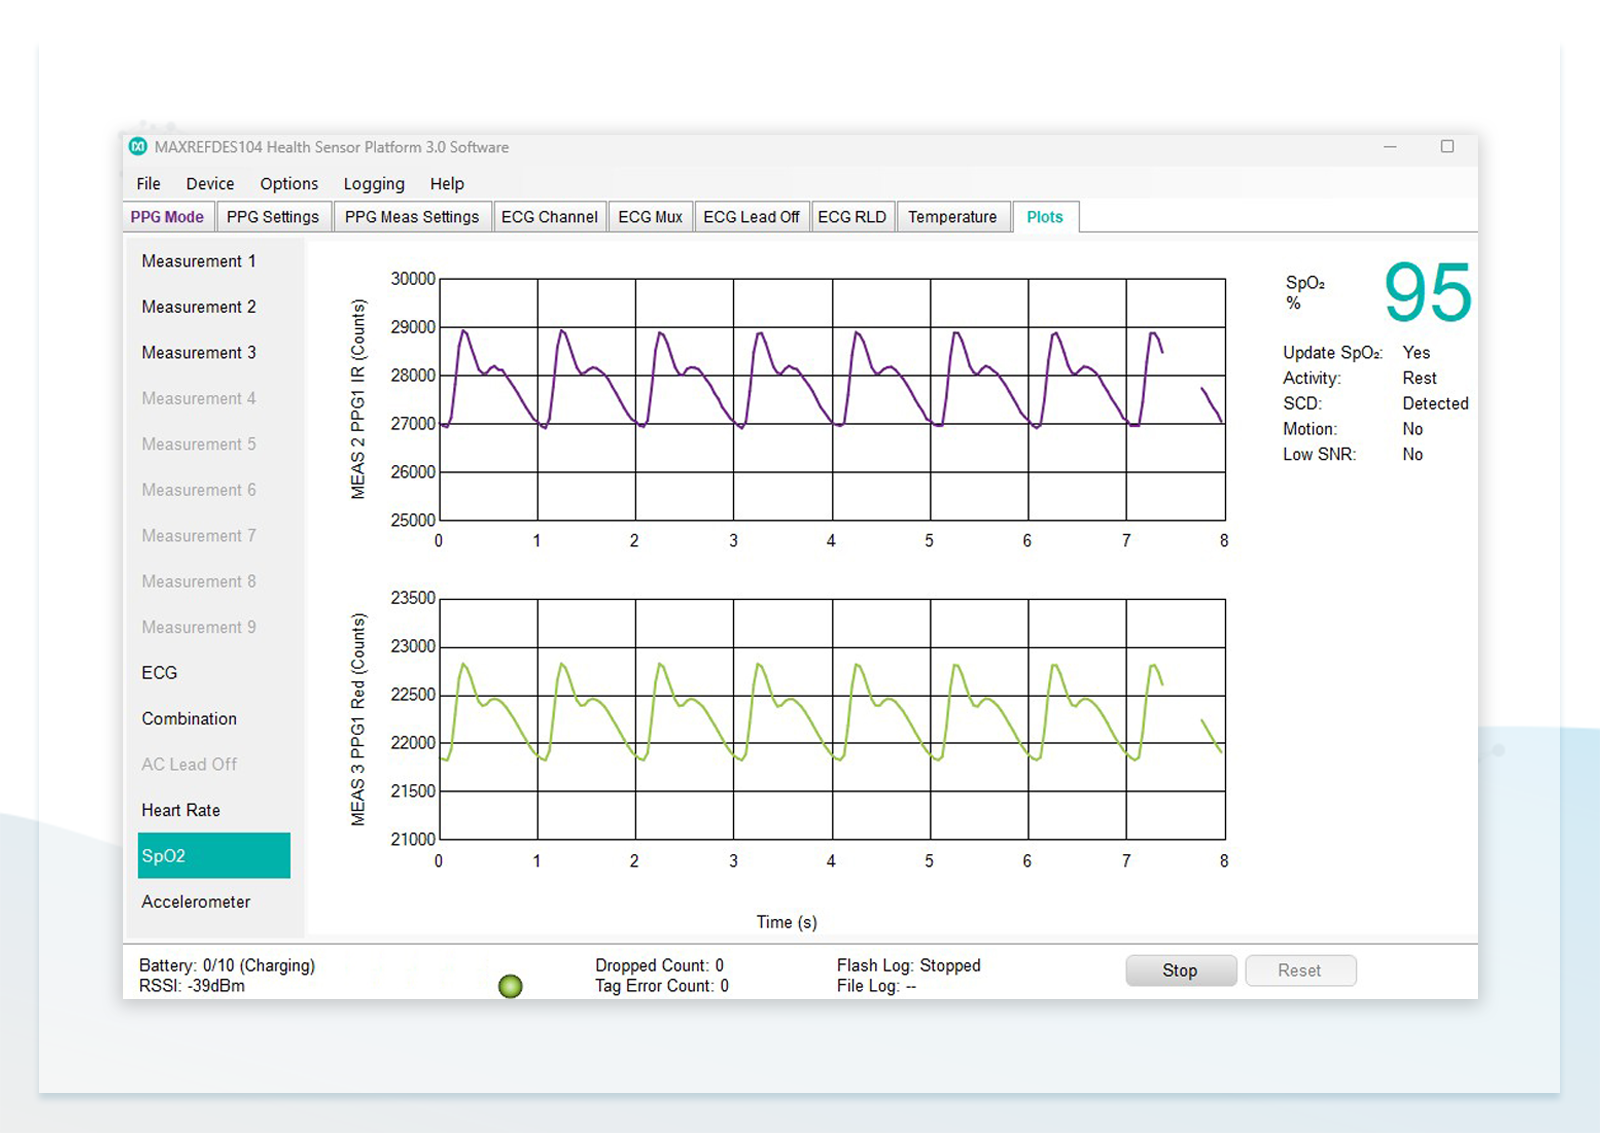
The figure below shows the SpO2 interface of the MAXRFFDES104 control software. The software communicates with the DUT via Bluetooth. The two waveform displays in the center represent the infrared and red light signals detected by the PD respectively. The ''SpO2 (%)'' value displayed in the upper right indicates the measured oxygen saturation.
【Figure 10】SpO2 interface of the MAXRFFDES104 control software
♦ Default SpO2 Settings of the AECG100
(1) Default parameters for the SpO2 function:
R curve: SpO2 = 110 – 25R
PI (R) = 2%, AC (R) = 12.5mV, DC (R) = 625mV
PI (IR) = 4%, AC (IR) = 25mV, DC (IR) = 625mV
Resulting SpO2 = 98%
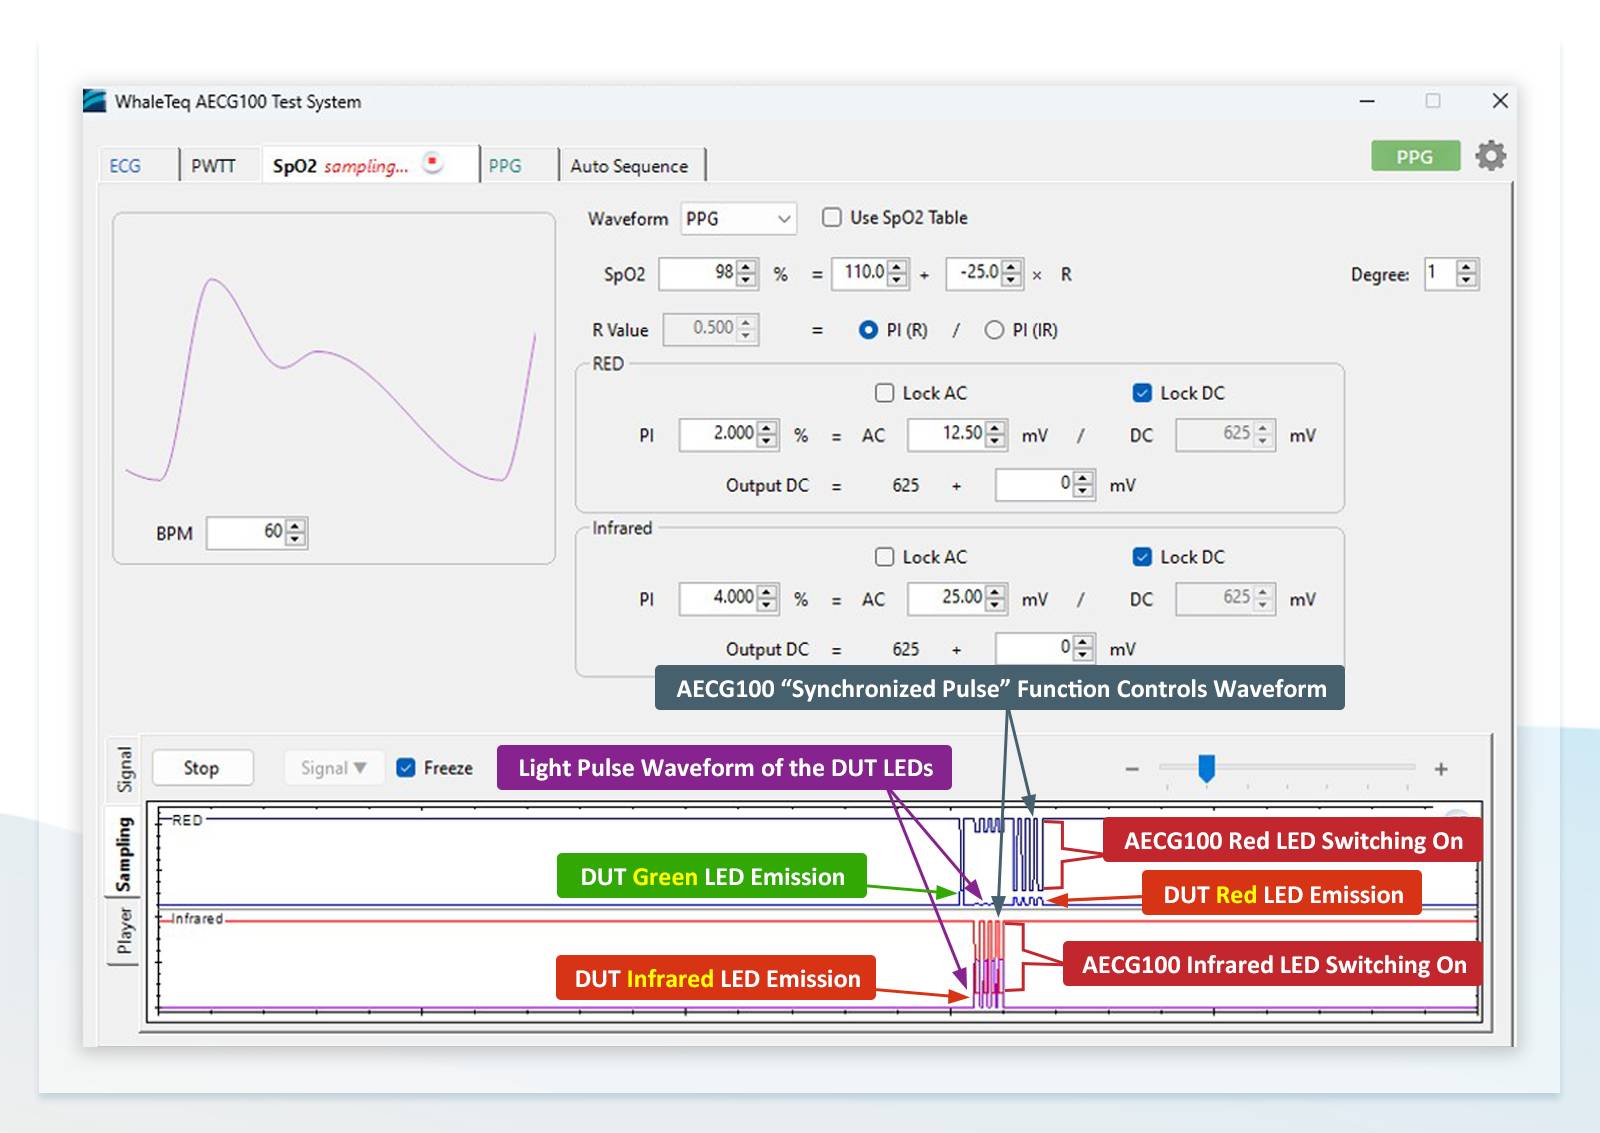
(2) After outputting this signal, click the ''Sampling'' button located at the lower center. This function displays the optical pulse waveform detected by the PPG module's PD from the DUT LED, and the synchronized LED waveform of the AECG100 (''Synchronized Pulse'' function).
From Figure 11, the emission sequence of the DUT LED pulses can be observed: one pulse of green light followed by four pulses of infrared light, then four pulses of red light.
Using the ''Synchronized Pulse'' function, it can also be verified that the AECG100 and the DUT LEDs are emitting light synchronously.
【Figure 11】The ''Sampling'' function showing the DUT LED emission sequence and confirming LED synchronization between the AECG100 and the DUT
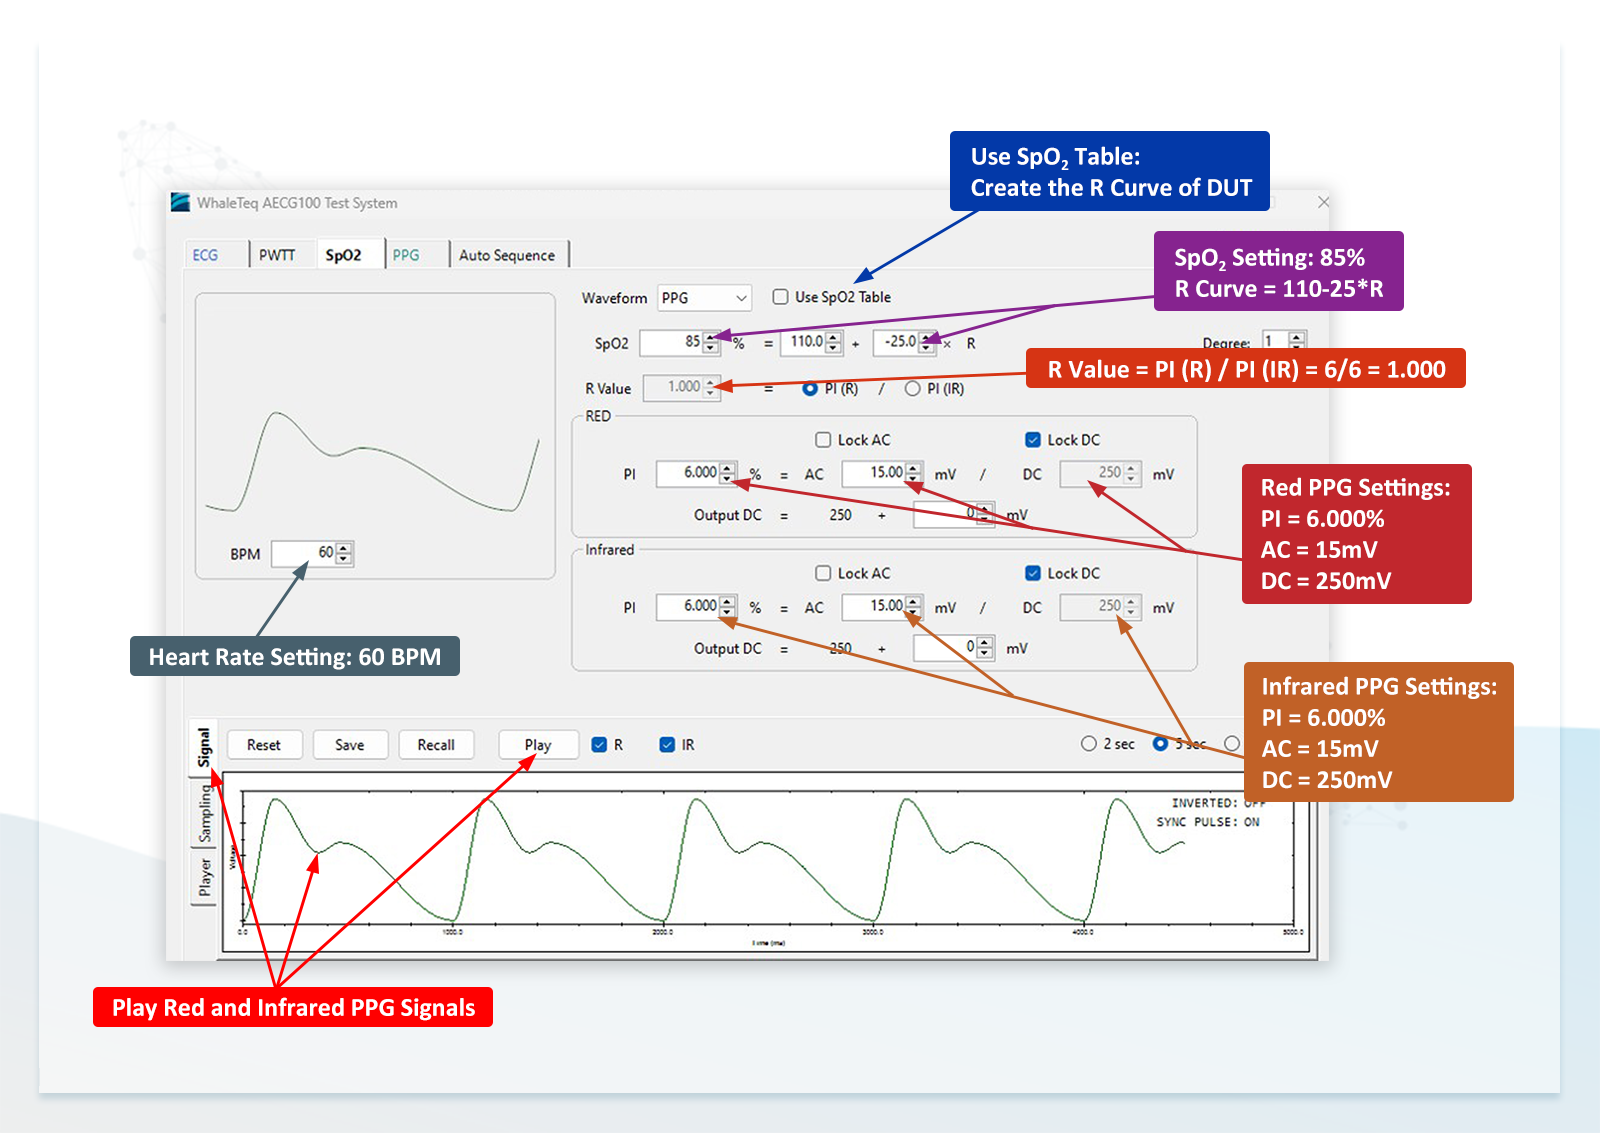
♦ Reconfiguring the SpO2 Settings on the AECG100
(1) Set both ''DC (R)'' and ''DC (IR)'' to 250mV, and lock these values using the ''Lock DC'' function.
(2) Set both ''AC (R)'' and ''AC (IR)'' to 15mV. At this point, ''PI (R)'' and ''PI (IR)'' are fixed as 6.0% (15 / 250 = 0.06), and ''SpO2'' is 85%.
However, the DUT actually measures SpO2 = 82%. This discrepancy is due to differences between the default R curve (110 – 25R) and the actual test environment. By correcting the R curve, more accurate SpO2 values can be obtained.
【Figure 12】Configuration of AC, DC, PI, R, and SpO2 parameters
♦ Deriving the DUT R Curve Using the SpO2 Table
To correct the R curve, the AECG100's capability to vary the R value is used to determine the DUT-specific R curve.
The default R curve of the AECG100 is SpO2 = 110 – 25R, which may not match the DUT's actual response. Therefore, even when the same R value is applied, the SpO2 measured by the DUT may differ from the AECG100 setting.
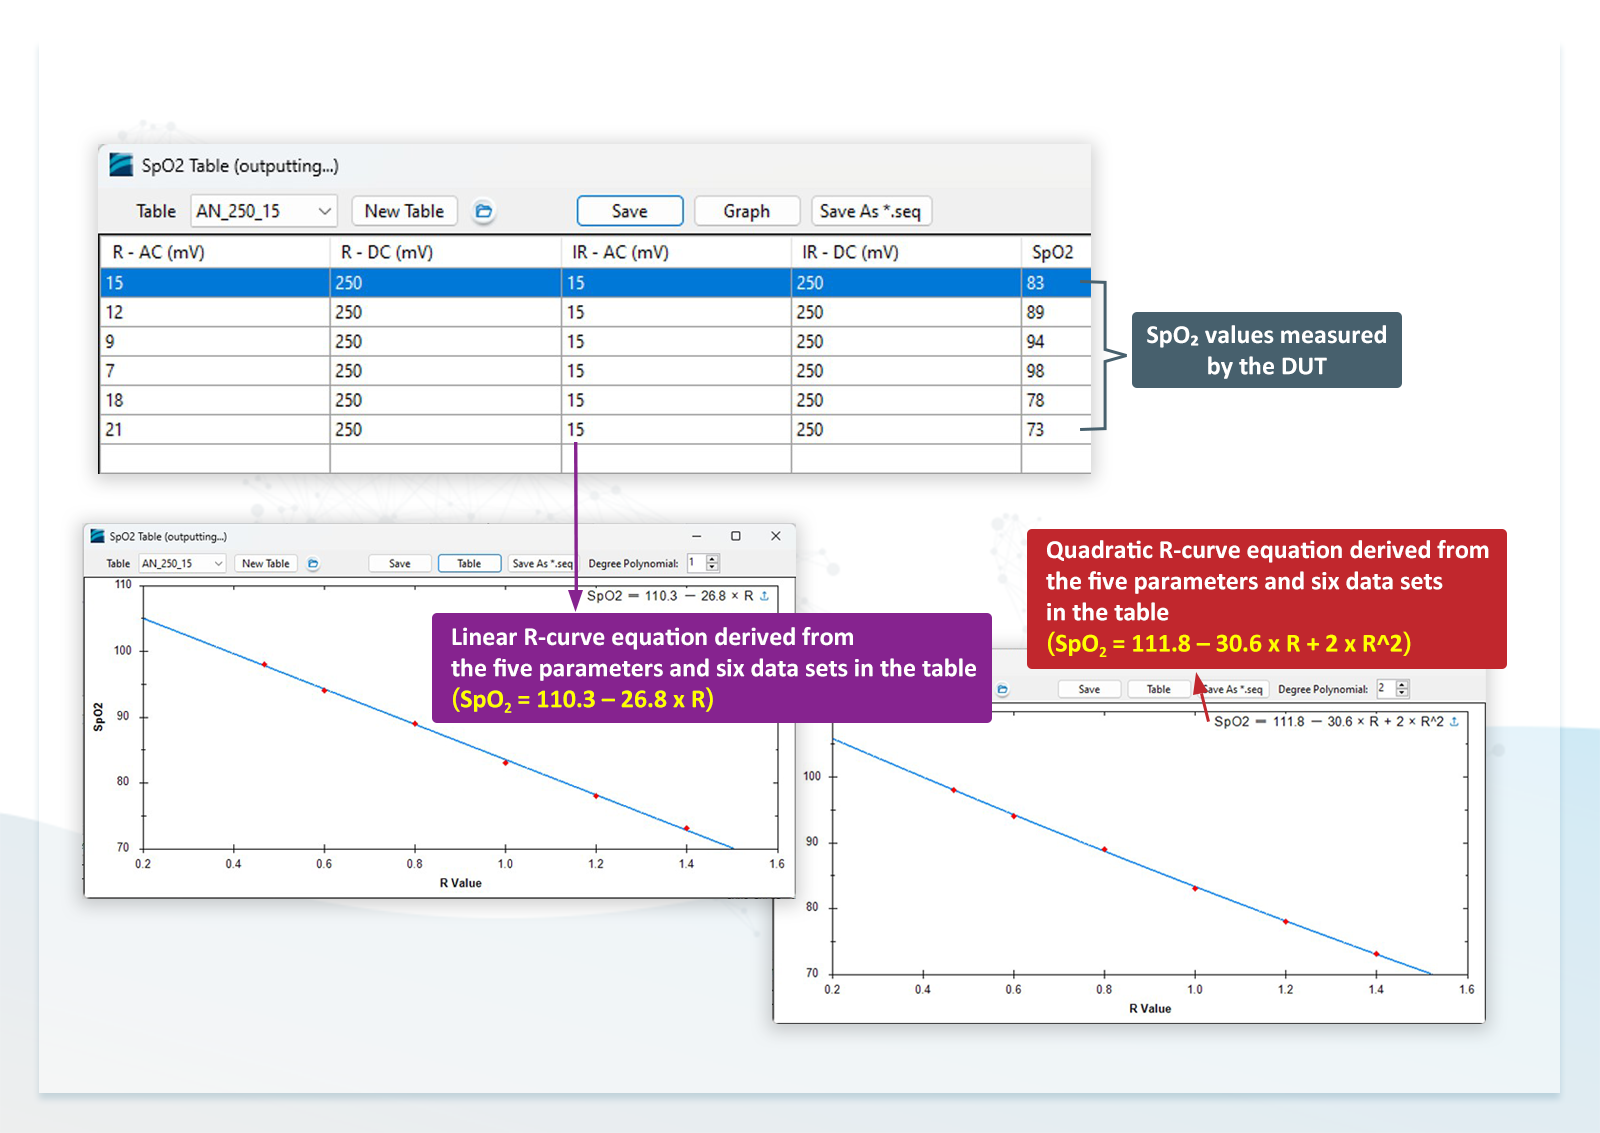
To obtain an R curve suitable for the current test environment, the actual SpO2 readings from the DUT are combined with corresponding R values to derive the curve equation. This is done using the ''Use SpO2 Table'' function (Figure 12), which creates a table of SpO2 and R values and calculates the corresponding equation.
The procedure for varying the R value using the AECG100 is as follows:
(1) Using the first row in Figure 13 as an example:
AC (R) = 15mV, DC (R) = 250mV → PI (R) = 15/250 = 6%
AC (IR) = 15mV, DC (IR) = 250mV → PI (IR) = 15/250 = 6%
R = PI (R) / PI (IR) = 1
(2) After setting these parameters, the AECG100 synchronously emits red and infrared light signals to the DUT PD. The DUT displays an SpO2 value of 83%.
(3) Adjust ''AC (R)'' to 12mV while keeping other parameters unchanged, then R = 4.8% / 6% = 0.8. The DUT displays an SpO2 value of 89%.
(4) Gradually increase AC (R) as AC (R) increases then R value increases accordingly and SpO2 value decreases. This produces a series of R values and corresponding DUT-measured SpO2 values.
This behavior is consistent with physiological conditions: Oxyhemoglobin and deoxyhemoglobin exhibit greater absorption variation for red light than for infrared light. Therefore, reflected red light varies more significantly than infrared light.
(5) Figure 13 includes six measured data points, with SpO2 ranging from 98% to 73%.
From these six data points, both linear and quadratic R curve equations can be derived. These equations represent the actual R curve of the DUT under the given test conditions and serve as a reference R curve.
【Figure 13】Creation of the SpO2 table and derivation of the DUT-specific reference R curve
♦ Using the New Reference R Curve to Test Additional SpO2 Values
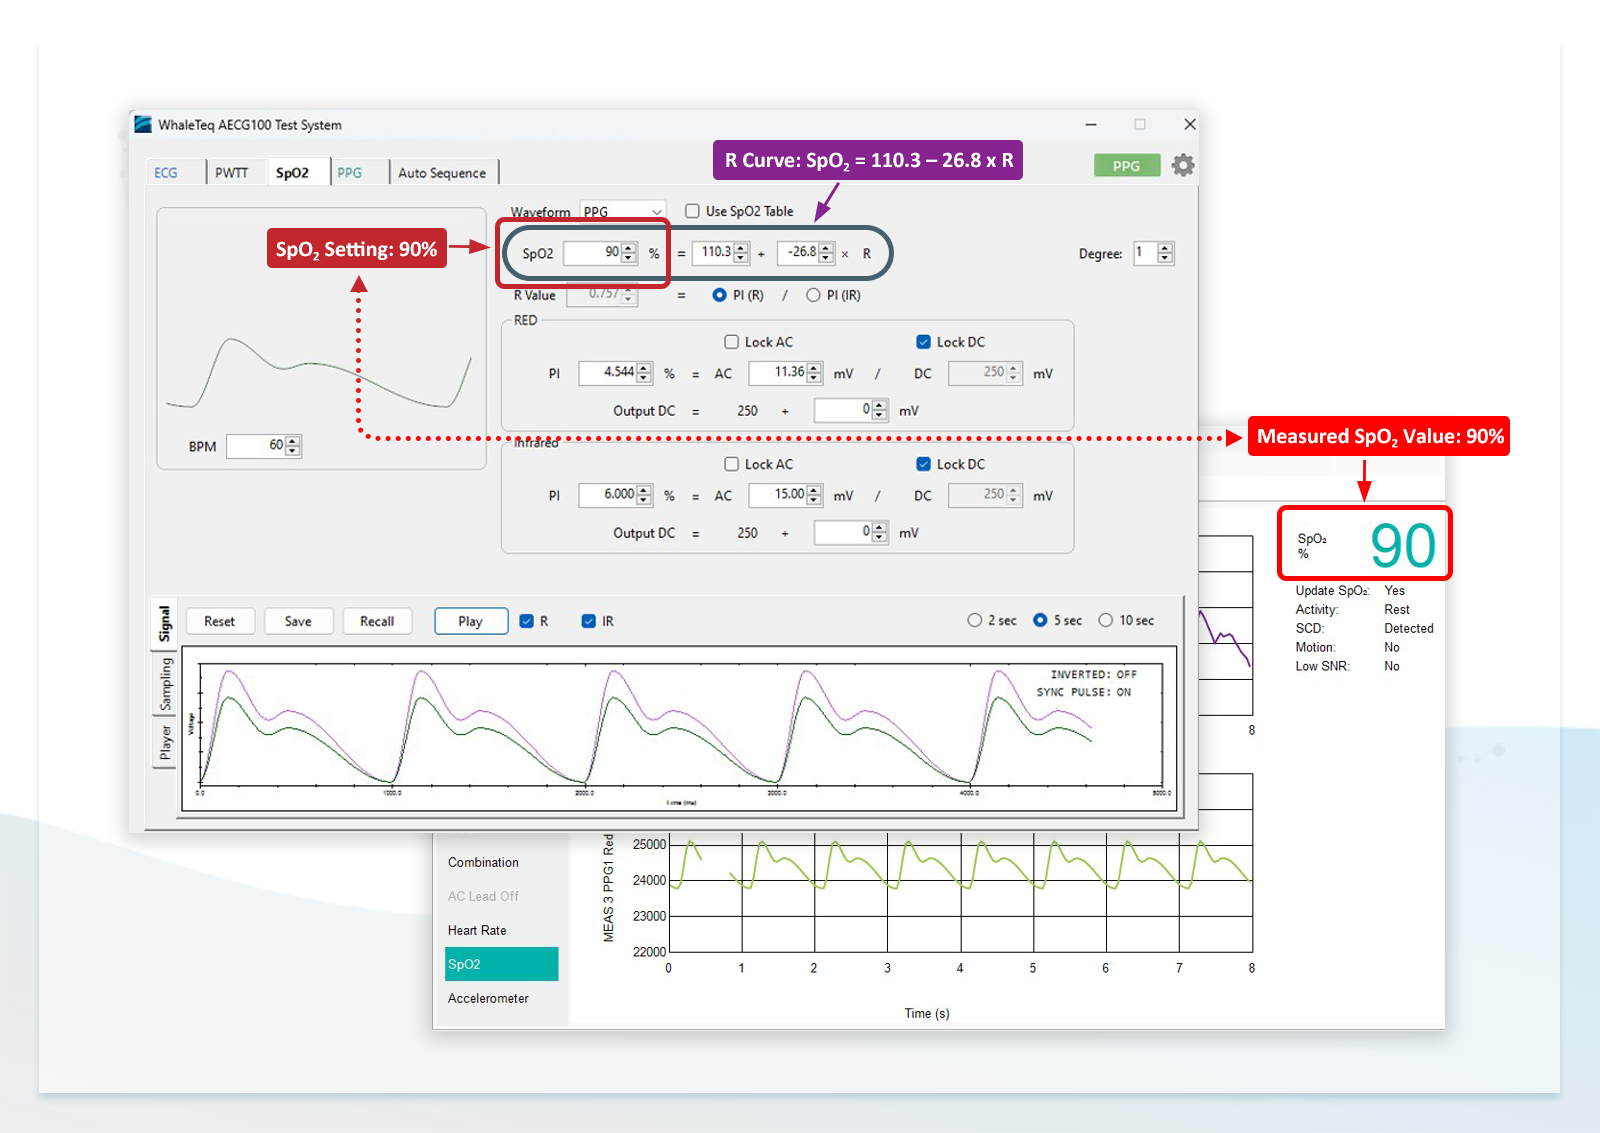
(1) Set ''SpO2'' to 90% on the AECG100, and the DUT also measures 90%.
(2) Set ''SpO2'' to 80% and 70%, and the DUT continues to accurately track the set values, with error less than 1%.
This confirms that, under these test conditions, the DUT can be evaluated using either the linear equation (SpO2 = 110.3 – 26.8 × R) or the quadratic equation (SpO2 = 111.8 – 30.6 × R + 2 × R2).
By using this approach, a wide range of SpO2 values can be tested using a single reference R curve. Alternatively, SpO2 value can be fixed while varying heart rate value to verify HR accuracy and range, ensuring SpO2 measured value remains stable.
Additionally, AC or DC values of red or infrared light can be scaled proportionally. Since ''R = (ACR/DCR) / (ACIR/DCIR)'', proportional changes keep R constant. Therefore, SpO2 remains unchanged. This method allows simulation of different skin tones and arterial elasticity conditions.
【Figure 14】Verification of DUT response at SpO2 value as 90% using the reference R curve
A SpO2 functional tester is used to verify the performance, measurement range, and stability of pulse oximeter devices. The method described above demonstrates that adjusting AC changes PI, and changes in PI affect the R value, SpO2 is then determined by the R curve.
The R curve can be either predefined or derived through testing. Establishing a reference R curve prior to clinical testing helps ensure stable measurement performance. Because this curve is obtained before clinical validation, it is defined as a reference R curve.
After clinical testing, the curve may be refined, resulting in a final (corrected) R curve. This final curve can then be used in quality control and production to ensure product consistency.
The method described above is based on reflectance wearable devices. Transmittance-type pulse oximeters can be tested using a similar approach. The main difference lies in the PPG module structure:
Reflectance type: LED and PD are on the same side
Transmittance type: LED and PD are on opposite sides
Accordingly, different PPG modules or fixtures are required, but the test principles and procedures remain the same.
Pulse Wave Transit Time (PWTT) Testing
PWTT refers to the time delay between the R-wave of the ECG signal and the peak or trough of the PPG signal. This delay essentially represents the time interval from the end of the QRS complex—when ventricular contraction begins—to the moment when blood ejected from the heart reaches the peripheral measurement site (e.g., the wrist, where the PPG signal is acquired).
This delay reflects changes in arterial blood pressure. When combined with additional parameters, it can be used to estimate systolic and diastolic blood pressure.
Some wearable devices on the market that integrate both ECG and PPG functions can incorporate PWTT calculations to enable blood pressure or blood pressure trend monitoring. Since the AECG100, together with the PPG module, provides both ECG and PPG signals, it allows users to configure the delay between these two signals to perform PWTT testing. The configuration method is shown in Figure 15.
【Figure 15】 PWTT configuration using the AECG100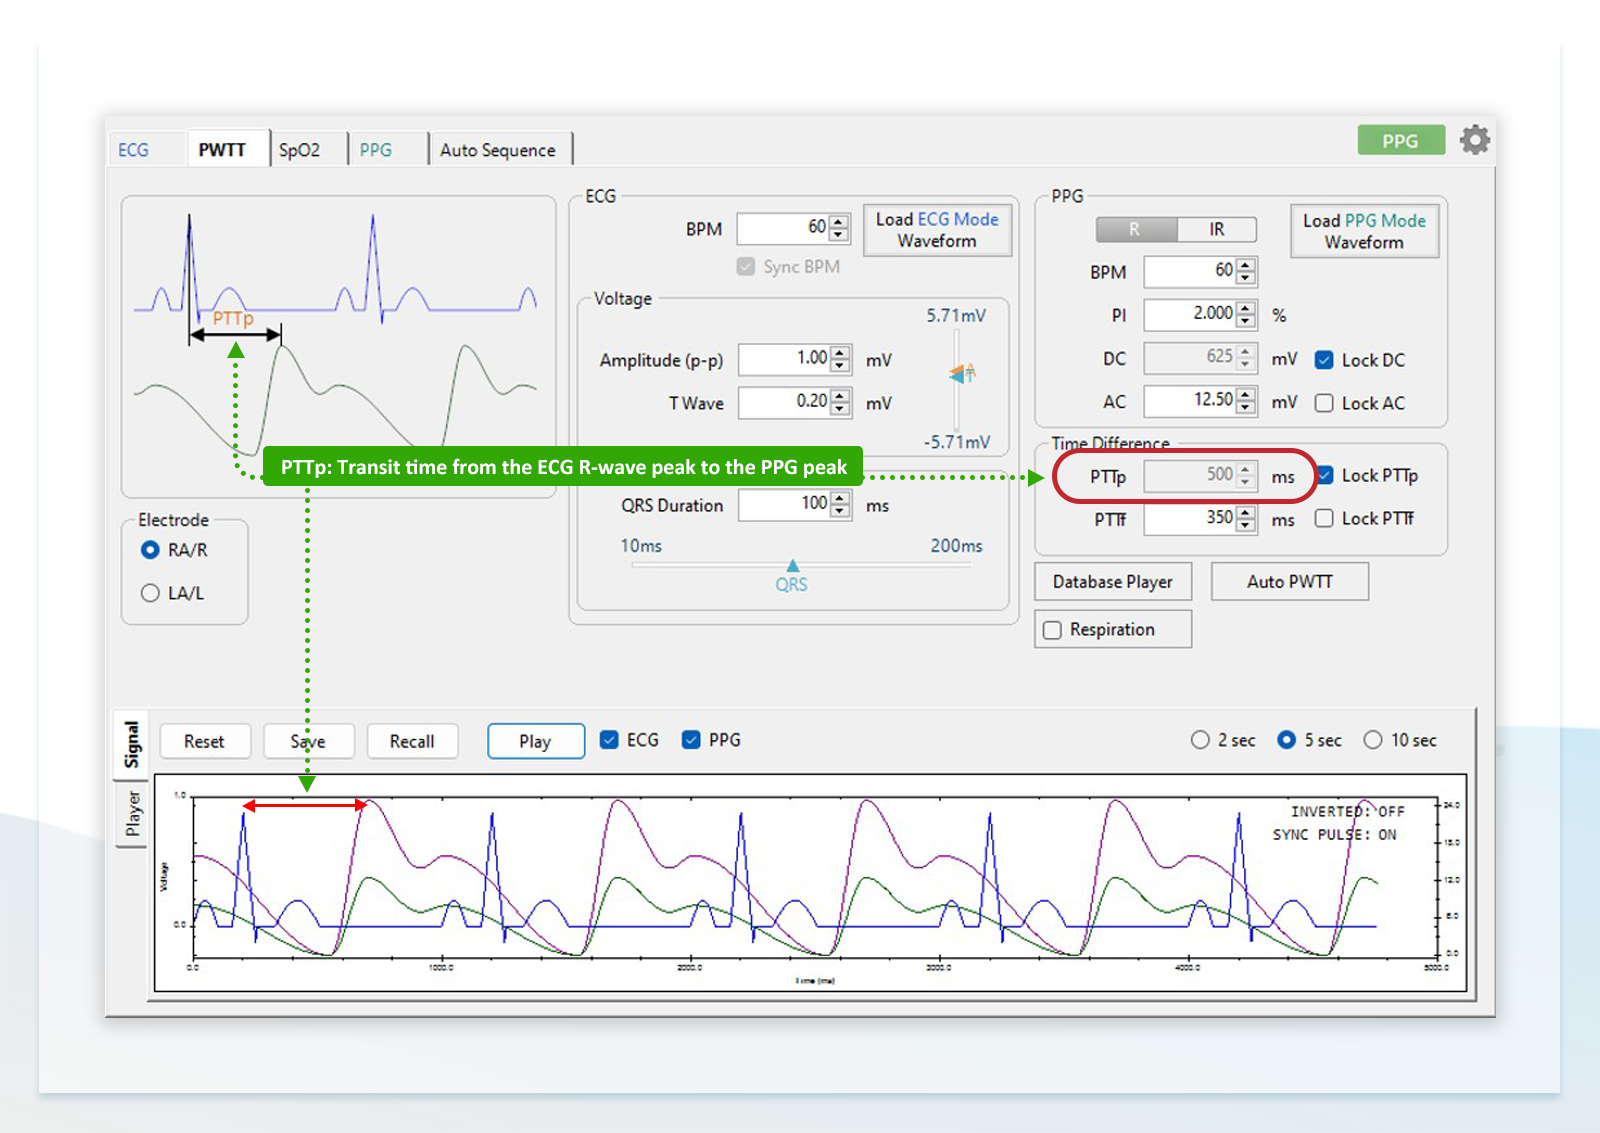
Application of the Multifunctional Performance Tester Across R&D, Quality Control, and Production
The ECG, PPG, and PWTT test methods described above can be used to verify whether the overall performance and accuracy of wearable devices meet standard requirements. In addition, the AECG100 is equipped with an SDK (Software Development Kit), enabling remote control via a computer through a USB interface.
These testing methods and requirements help R&D teams define technical specifications at the early stages of product design. During development, the AECG100 can be used to perform step-by-step verification of both hardware and software functions, either in accordance with applicable standards (for ECG functions) or through customized test procedures (for PPG and PWTT functions).
During the R&D phase, whether for developing and tuning heart rate and SpO2 algorithms or for overall system validation, the AECG100 paired with the PPG module can simulate various real-world scenarios—such as walking, running, and resting—by configuring the required parameters. This enables evaluation of device stability and accuracy under different conditions.
For quality control and production stages, the required test items can be defined based on recommendations from the R&D team or determined independently. These tests generally need to be fully automated. By leveraging the SDK for remote control, a single program can be used to control the AECG100, the DUT, and other equipment, execute test procedures, and determine pass/fail results.
When defining test items independently, for medical-grade devices, testing all items is recommended to ensure that every unit meets functional and specification requirements; for non-medical devices, selected key tests may be sufficient. For example, amplitude, frequency, and noise-related tests for the ECG function, fixed sets of HR and SpO2 values for the PPG function.
In quality control testing, the reproducible and standardized test parameters provided by the AECG100 help verify consistency across different production batches. They also improve the efficiency of regression testing by reducing the risk of human-induced variability when comparing different firmware versions and algorithms.
When deployed on the production line, the AECG100 can use the SDK to control test parameters and procedures, execute predefined test items, and collect measurement results from the DUT. This enables rapid verification of measurement accuracy.
In addition, it can be used to calibrate potential measurement deviations in LEDs and PDs, ensuring that each product meets the manufacturer's specifications regardless of component variation or assembly differences.
【References】
1. ISO80601-2-61:2018
2. WhaleTeq AECG100 User Manual

