
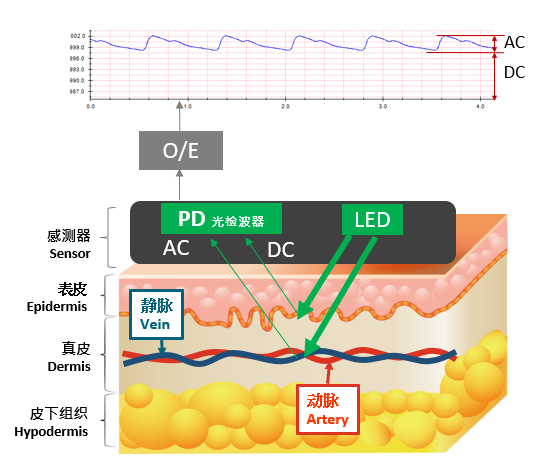
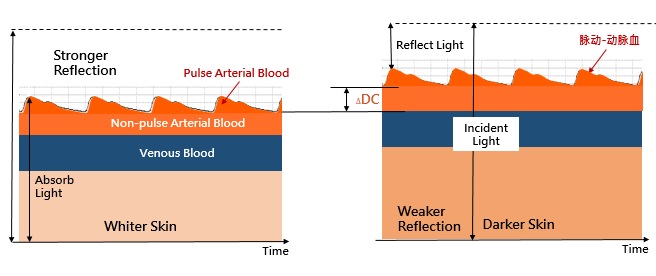
People with darker skin will absorb more incident light, so the reflected light is weaker. Due to the fact that skin, tissues and veins do not change in volume with heart beat at a steady state, the intensity of the absorbed light and reflected light is stable, converted to direct current (DC) through a photodetector (PD). Therefore, if the simulator can emit different intensity LED light, then it can achieve the goal to simulate different user skin tones. AECG100’s PPG module provides users to adjust different DC levels to emit different LED intensities.
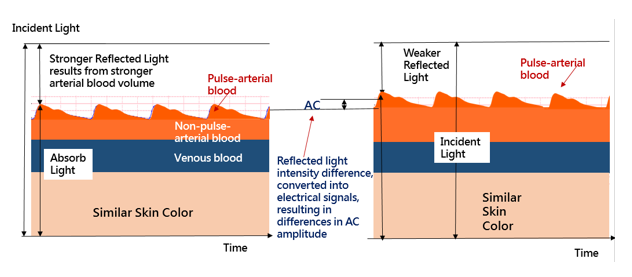
At the same time, arterial blood volume changes when heart beats. We can refer the arterial blood volume change as an alternating current (AC) signal comparing to the larger DC signal. AECG100 also provides the capability to allow users to adjust the AC level to simulate different arterial blood volume.
The AECG100 cannot simulate different ambient light conditions at this version. Alternatively, the AECG100 has data playback function, which offers users to record their self-collected waveform with different ambient light conditions and then play these recorded waveforms back from the AECG100 to simulate such condition.
After setting properly, the AECG100 is a fixed intensity output, and the output intensity does not support the corresponding DUT LED intensity change.
The first possibility is the position between the AECG100 and DUT. Or to be more specific, the DUT's LED and the tester's PD are not talking to each other due to position problems. Here are some examples:
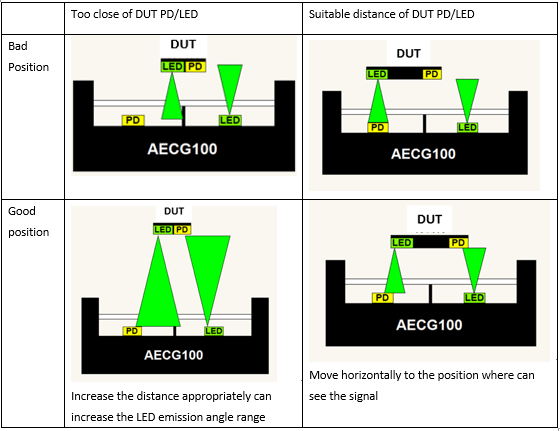
Because of the LED emission range and mechanism issues, it may be necessary to adjust the DUT location to the position where the signals can be seen.
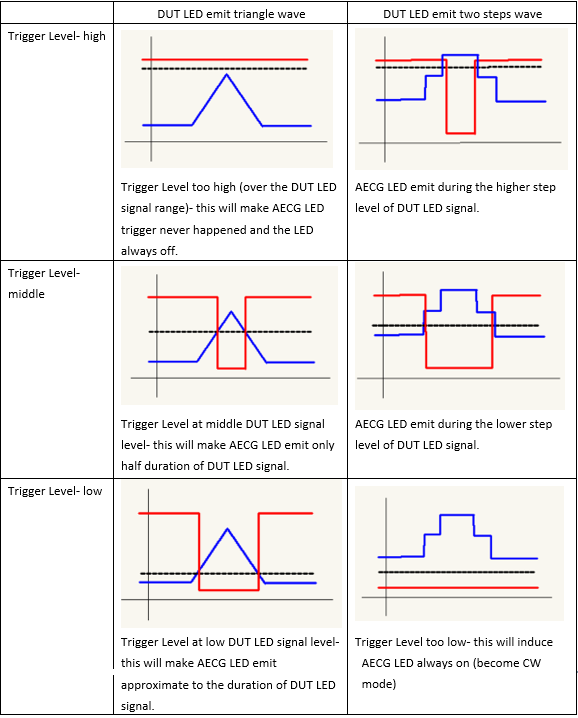
AECG100 trigger level is the threshold level to trigger AECG100 LED on (emit the light), through a LED switch to control AECG100 LED on/off. If trigger level over DUT LED signal range, it will induce AECG100 LED not to emit the light. If it's under the range, it will induce AECG100 LED always emit the light (become CW mode). Both conditions will make the DUT have no responses to AECG100 LED behaviors. Therefore, the appropriate trigger level is important for some no respond conditions. Please refer to the table below:
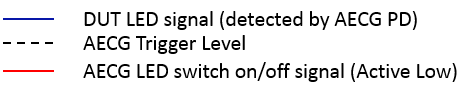
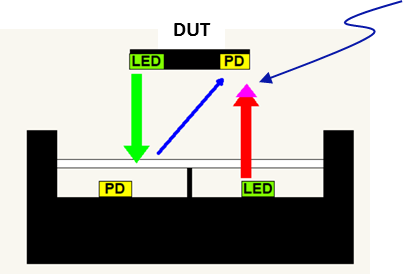
As shown above:
Blue arrow represents the DUT reflection light or outside ambient light which be reflected by AECG100 mechanism.
Red arrow represents AECG100 LED emit light (DC part)
Pink arrow represents AECG100 LED emit light (AC part)
Therefore, the light received by DUT PD can be simply as shown in the following figure (the AC/DC amplitude is not proportional, actual AC amplitude is much smaller than DC amplitude).
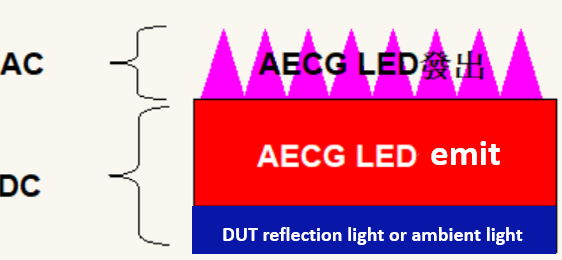
If the blue area is very small (compared to the red area) or is constant (predictable level and can be deducted from the red area), which will not cause interference.
When the application is single color light (such as green light), DC is a fixed value and the blue part is not deducted from the application. It doesn't affect the test too much.
SpO2 value is related to the ratio of R(PI)/IR(PI), PI= AC/DC, for different wavelengths of light and mechanism, the ratio of the red to the blue area is different, so it can't make the blue area small enough to ignore it (isolate the reflection light), or to be able to accurately deduct the predictable level in advance, will cause a large error in SpO2 calculation.
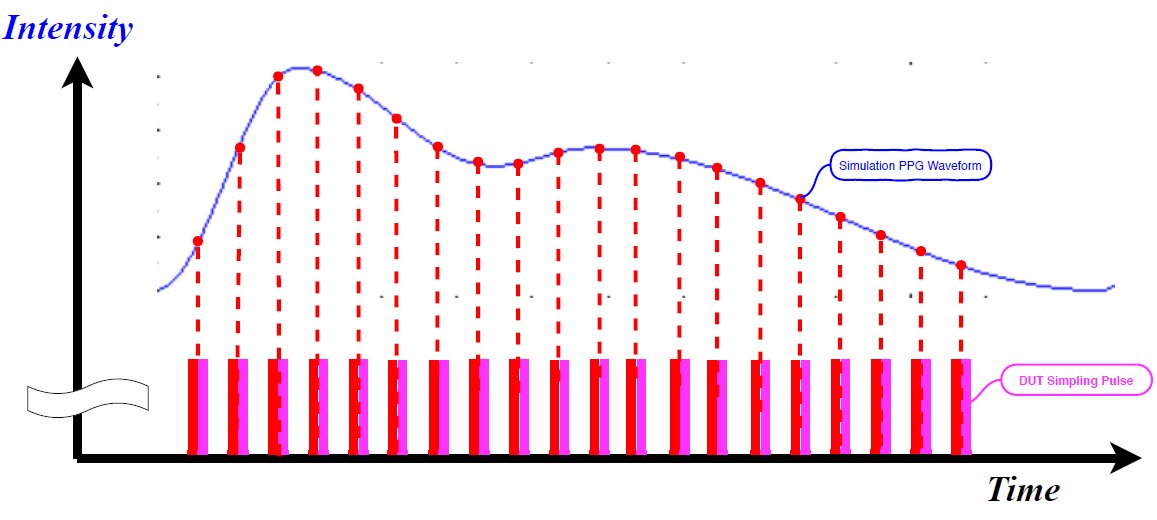
As shown in the above figure, the DUT will light during the sample interval. The sample wave in the above picture maybe is a group pulse of each time interval (one pulse or more pulses).
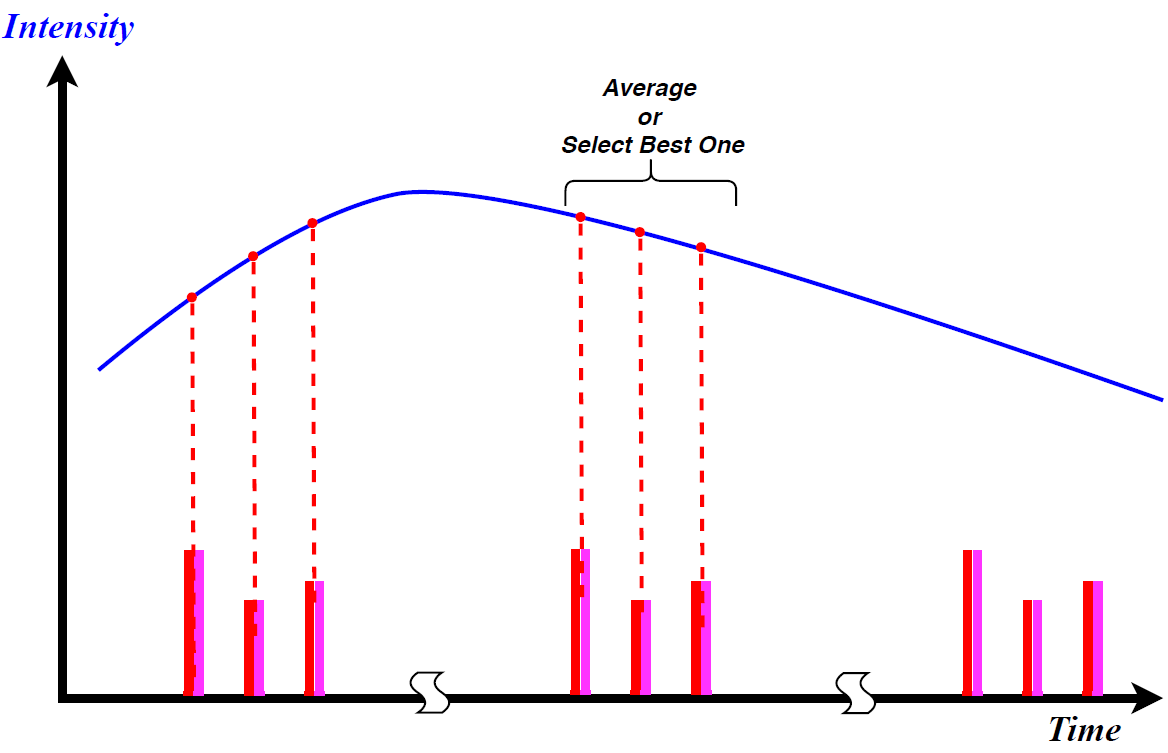
The above figure shows that the sampling group at each sample interval subdivided to 3 pulses. Taking a single green light as an example, the pulse may be a switch from a different position LED, and the LED intensity of each switch is not necessarily the same. After sampling, take which group to calculate will base on the algorithm of each DUT.
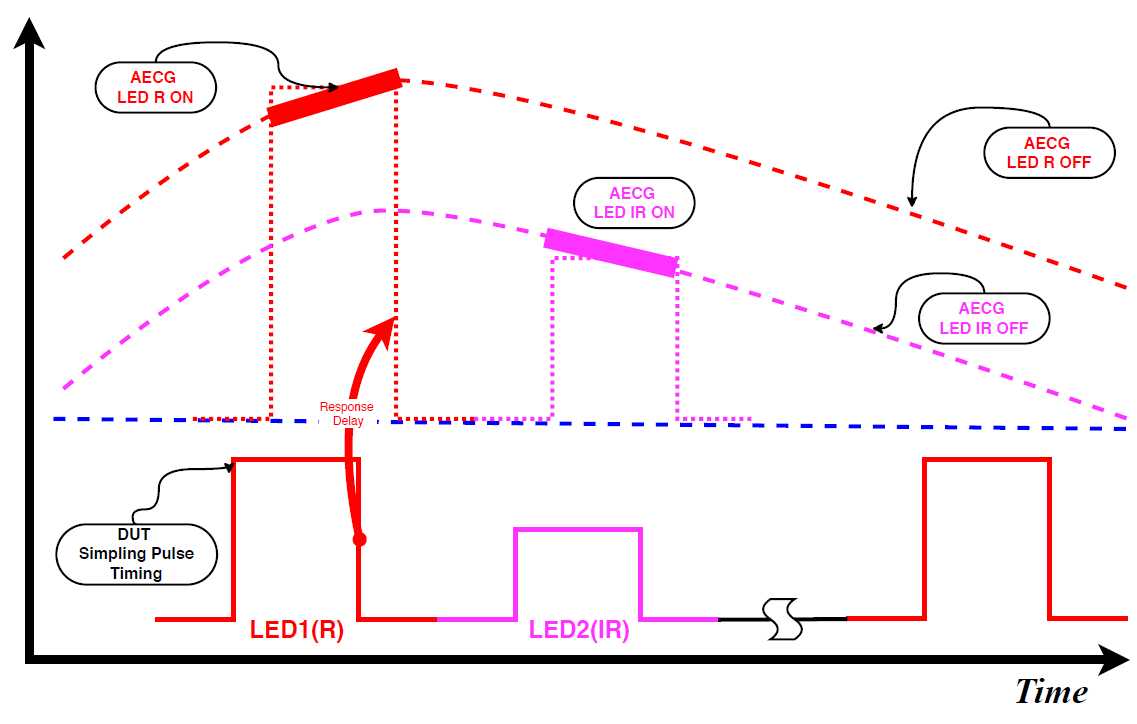
Take SpO2 (R/IR) testing as an example, AECG100 LED ON/OFF is based on the Sampling Pulse Timing of DUT. As the electrical circuit would have response delay and DUT's Red LED and IR LED normally would turn on in sequence, the AECG100 will determine to emit the corresponding LED signals right after the detection of DUT's optical signals.
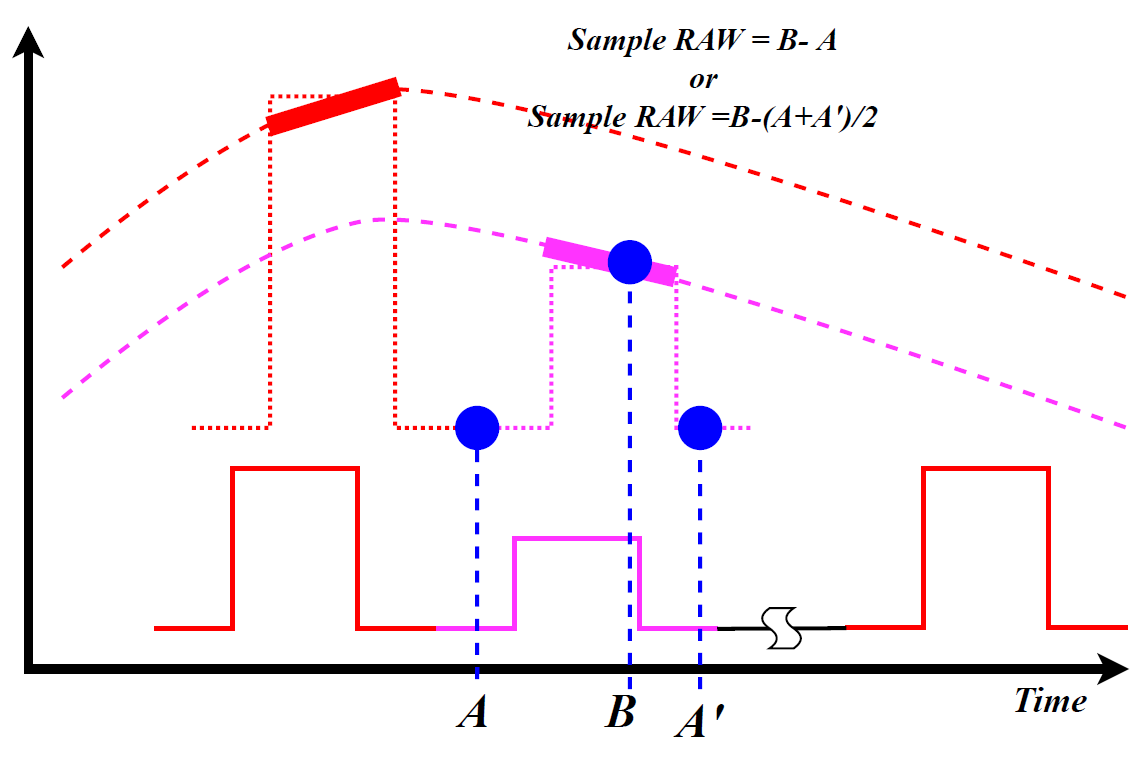
The above figure shows that how to take the sample data (RAW data) and the ways to calculate the sample values. The red diagonal line is the area where there is no light, A and A' are the sample values when the light is turned off, and B is the sampled value received after the light is turned on. Currently, most of the above two algorithms are used as sampling RAW data. The A point is best taken before lighting, and the B point is best after the LED is stable and before turning off the light, A' is best to sample after the light is turned off and stable, this time point may pay special attention, DUT LED may not be extinguished immediately (A or (A+A')/2 is regarded as the background value of ambient light or noise...).
It may be possible, the biggest problem with different wavelengths is the testing standards and processes, each different wavelength LEDs may require us to prepare a set of testing standards, which may require extra effort and cost at the moment.
Currently, HRS/AECG PPG series can detect the light intensity through ADC of PD, but with some limits to display the detective values, for example, when LED light is too strong or too weak, or the light pulse duration is too short. In this case, please connect the signal directly to the oscilloscope and observe the value received by the PD from the oscilloscope.
If there is no requirement of ECG or SpO2 development, only the HRS200 is enough.