
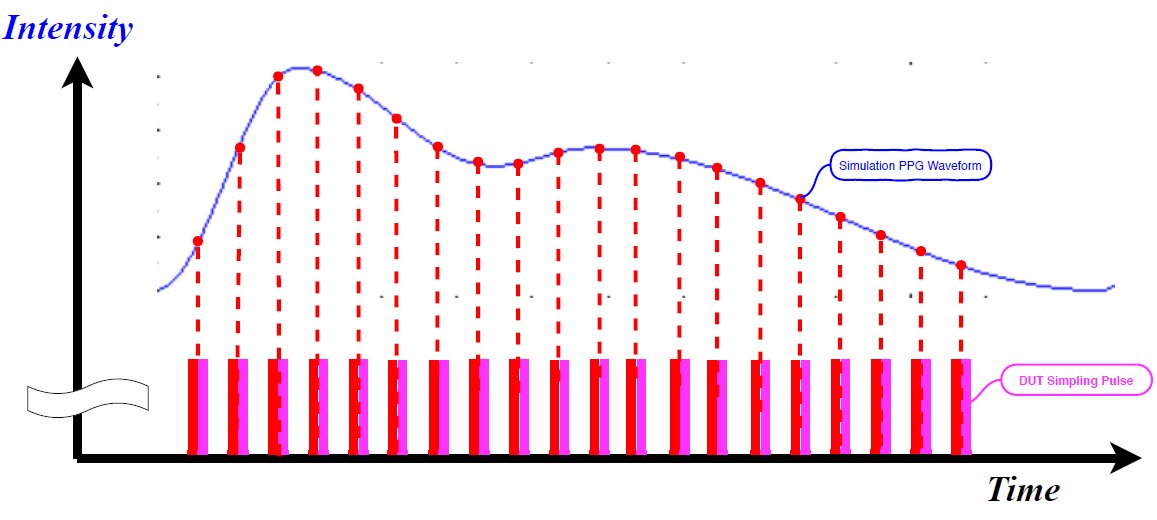
As shown in the above figure, the DUT will light during the sample interval. The sample wave in the above picture maybe is a group pulse of each time interval (one pulse or more pulses).
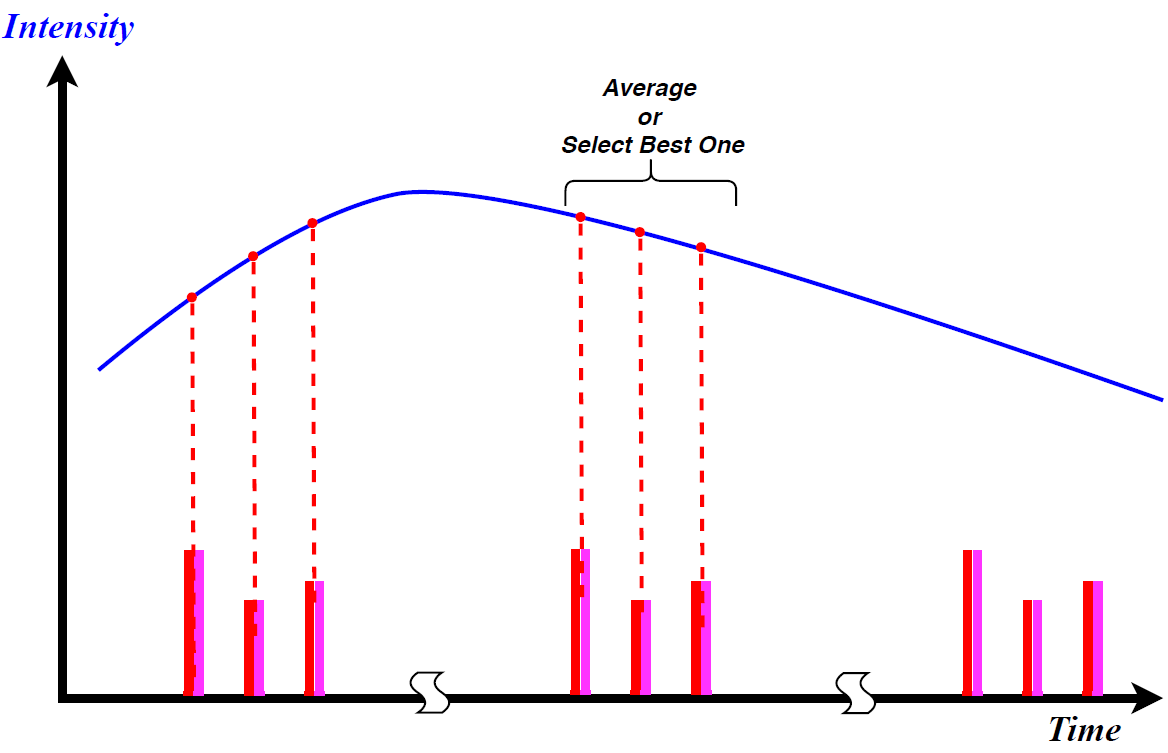
The above figure shows that the sampling group at each sample interval subdivided to 3 pulses. Taking a single green light as an example, the pulse may be a switch from a different position LED, and the LED intensity of each switch is not necessarily the same. After sampling, take which group to calculate will base on the algorithm of each DUT.
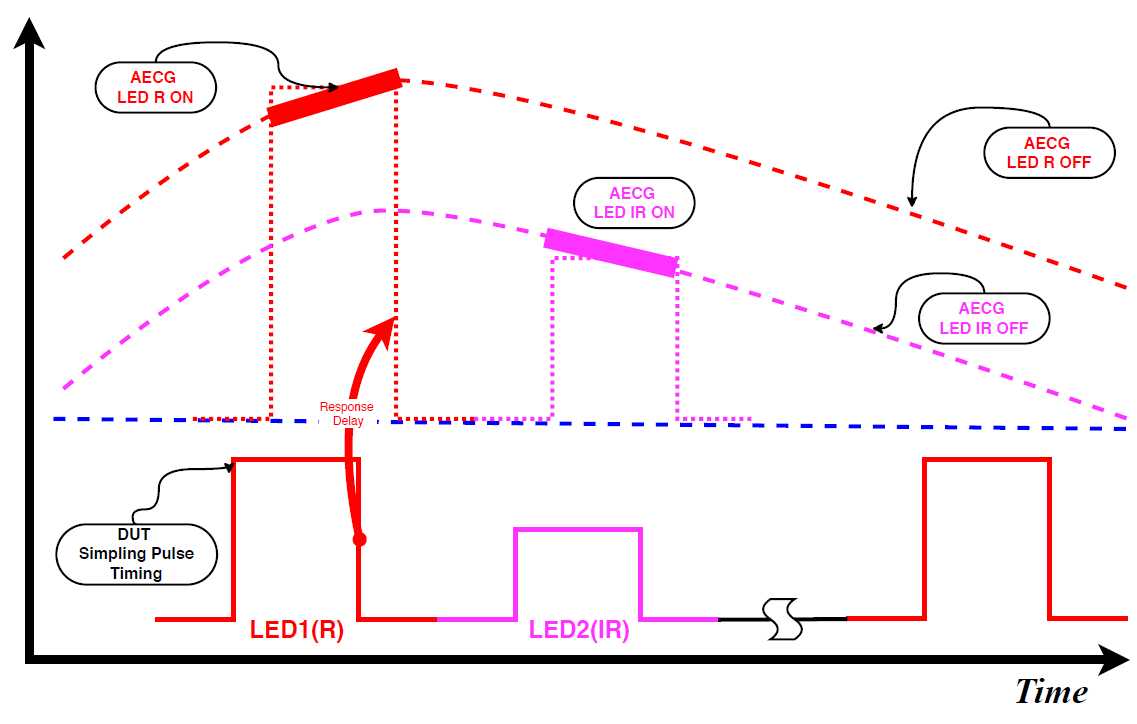
Take SpO2 (R/IR) testing as an example, AECG100 LED ON/OFF is based on the Sampling Pulse Timing of DUT. As the electrical circuit would have response delay and DUT's Red LED and IR LED normally would turn on in sequence, the AECG100 will determine to emit the corresponding LED signals right after the detection of DUT's optical signals.
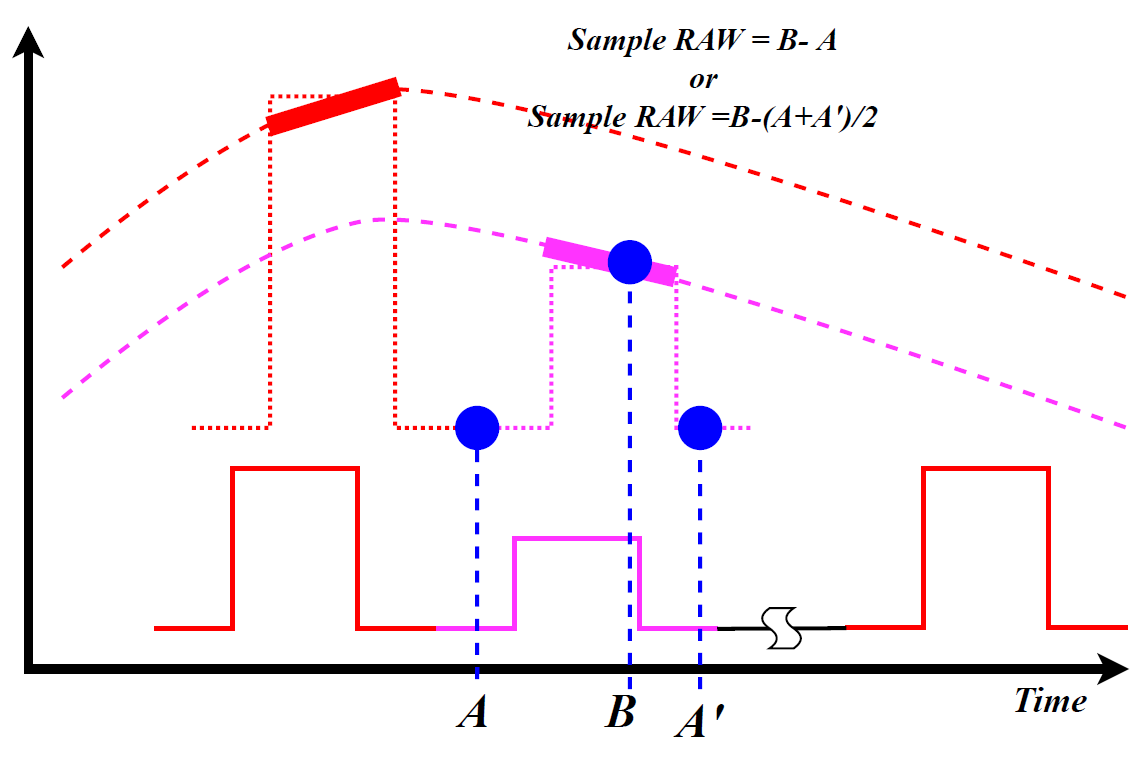
The above figure shows that how to take the sample data (RAW data) and the ways to calculate the sample values. The red diagonal line is the area where there is no light, A and A' are the sample values when the light is turned off, and B is the sampled value received after the light is turned on. Currently, most of the above two algorithms are used as sampling RAW data. The A point is best taken before lighting, and the B point is best after the LED is stable and before turning off the light, A' is best to sample after the light is turned off and stable, this time point may pay special attention, DUT LED may not be extinguished immediately (A or (A+A')/2 is regarded as the background value of ambient light or noise...).
It may be possible, the biggest problem with different wavelengths is the testing standards and processes, each different wavelength LEDs may require us to prepare a set of testing standards, which may require extra effort and cost at the moment.
Currently, HRS/AECG PPG series can detect the light intensity through ADC of PD, but with some limits to display the detective values, for example, when LED light is too strong or too weak, or the light pulse duration is too short. In this case, please connect the signal directly to the oscilloscope and observe the value received by the PD from the oscilloscope.
If there is no requirement of ECG or SpO2 development, only the HRS200 is enough.
Yes, the AECG100 can control the time difference between PPG and ECG signal, this function can help DUT to verify the PWTT accuracy.
No, it is currently in the same operating software, but the operating software will detect the difference of the module, automatically set the different operation screens.
Shading, light blocking, need DUT to deal with the mechanism.
The AECG100 has more function as follows:
(1) Supports SpO2
(2) More waveform parameters setup
(3) More PD Sample Rate
(4) Software control LED maximum light intensity (shipping SW only)
(5) SW control trigger level
Can simulate skin color by controlling the DC value of PPG simulator, but the real connection between skin color and DC value needs to be defined by the user.
A. Please refer the answer to the question 1. First, roughly determine the positions of both PD/LEDs. DUT must be able to see the simulator output waveform and the both parties need to see each other. AECG100 reflective series, the R and IR positions are as shown in the photo below:
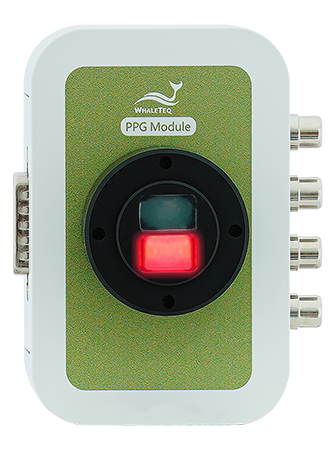
(For reference only)
B. How to determine that AECG100 has detected the optical signal of the DUT?
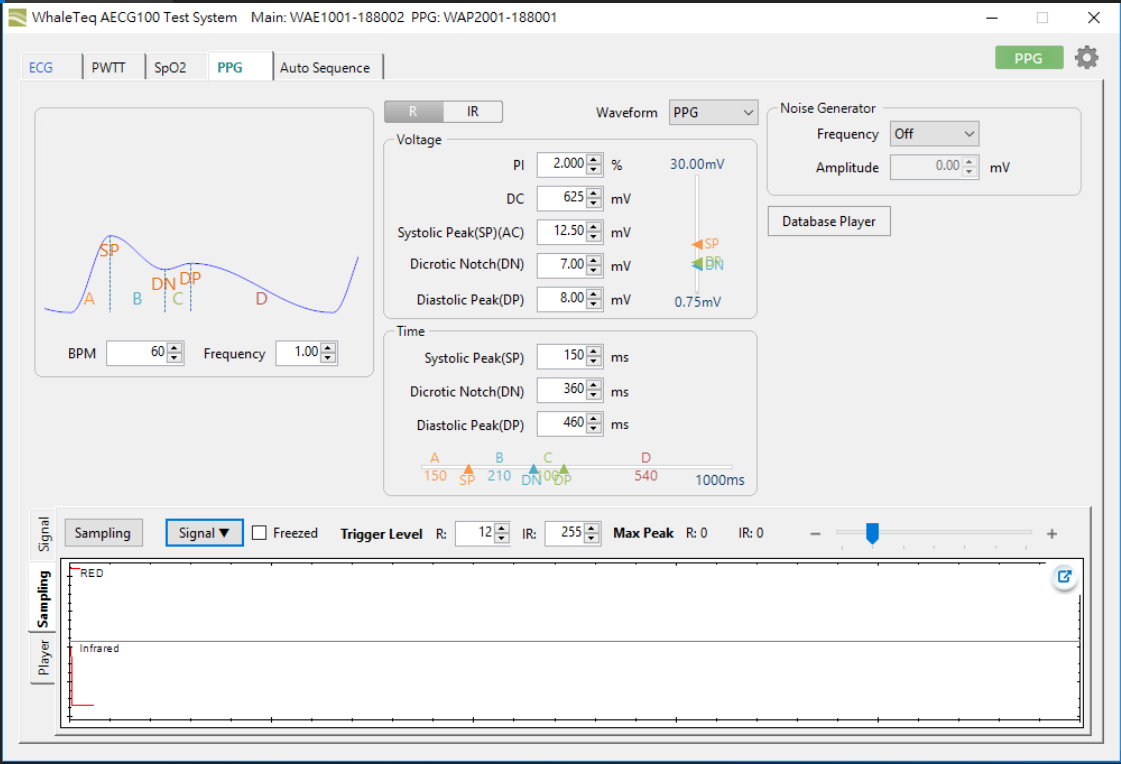
1) In the following screen of the AECG100 software, click on the “Sampling” (vertical writing) in the screen lowest left corner (do not start the simulator “Play” function at this time):
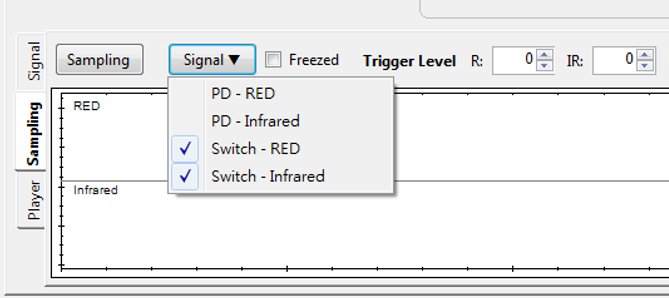
2) Click “Signal”, check “Switch-RED” and “Switch – Infrared” , as below photo:
3) Click “Sampling” (horizontal writing), start the sample function.
4) Select the -/+ amplify range to properly display the detective intensity, as below photo:

5) May click “Freeze” function to freeze the captured waveform, as below photo:
6) Using TI AFE4403 EVM as DUT, can see the waveforms as follow figure:
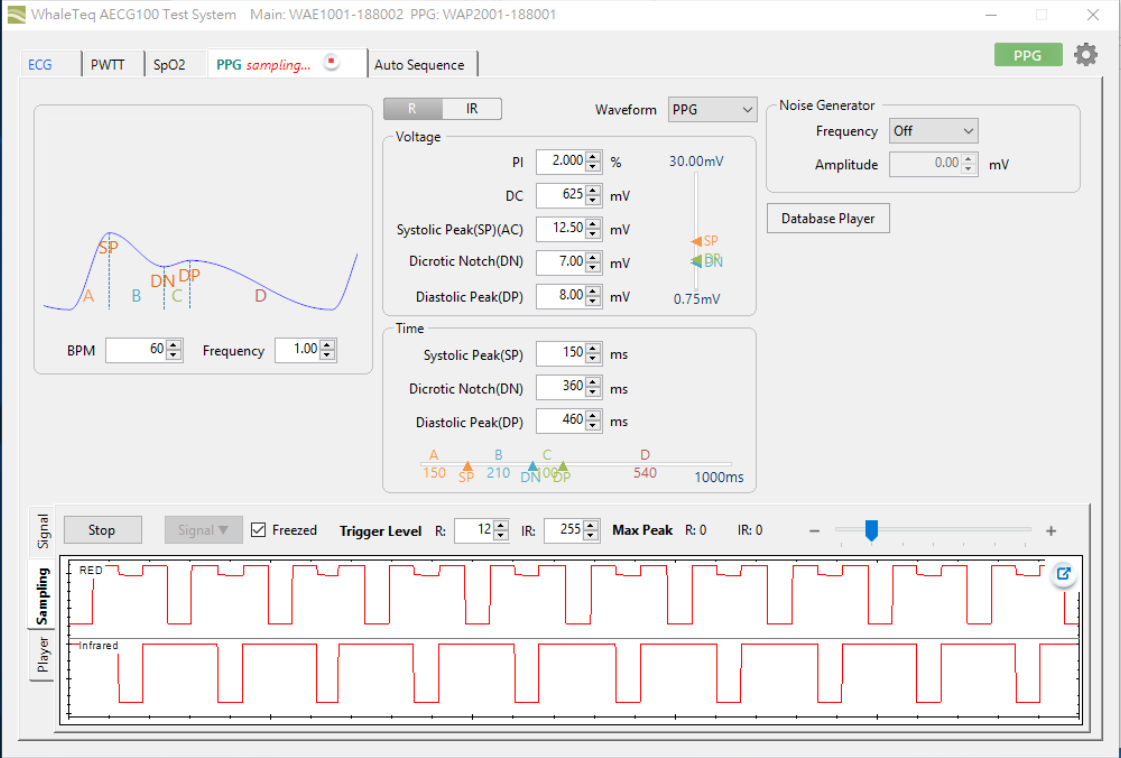
Two lights should be interlaced startup (Low Active), if there is only high or only low Condition, the “Trigger Level” should be adjusted.
7) Trigger Level adjust explanation:
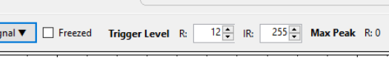
Dynamically adjust R/IR Trigger Level value without Freeze and proper magnification, the order is, first fix the IR at the maximum value of 255, because the IR switch will affect R switch. In this case, the switching mode of the IR should be at a high level, if it is at a low level, indicates that the simulator has a problem or the light of the DUT is too strong (need to adjust the hardware parameters of the simulator), if the IR is stable at the high level, you can further adjust the value of R, slowly adjust from high to low until you see the appropriate stable low level pulse, and then adjust the IR Trigger Level slowly decreases until you see a stable, interlaced low pulse. At this point, it means that AECG100 can see the sequence of the DUT light turn on stably, if cannot get the correct adjustment, the AECG100 need to troubleshoot or adjust the inside hardware parameters of AECG100.
C. Confirm DUT received the light of AECG100
This part needs to be judged from the information received by the DUT. We recommend setting the two lights to different types of waves first. After adjusting the Trigger Level, stop Sampling and return to the following screen.
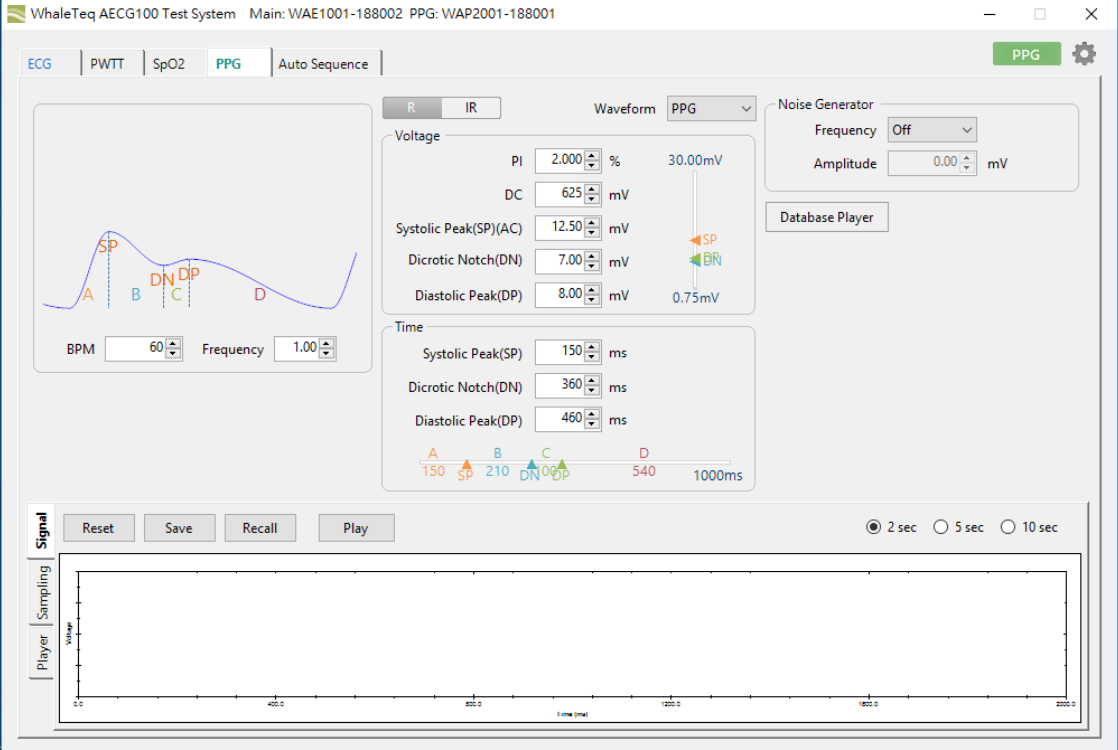
Select R or IR, as follows:
Select waveform type, as follows:
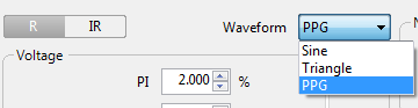
And then click ”Play” to play the waveform, as follows:

DUT is TI AFE 4403 EVM, the detected waveforms as follows:
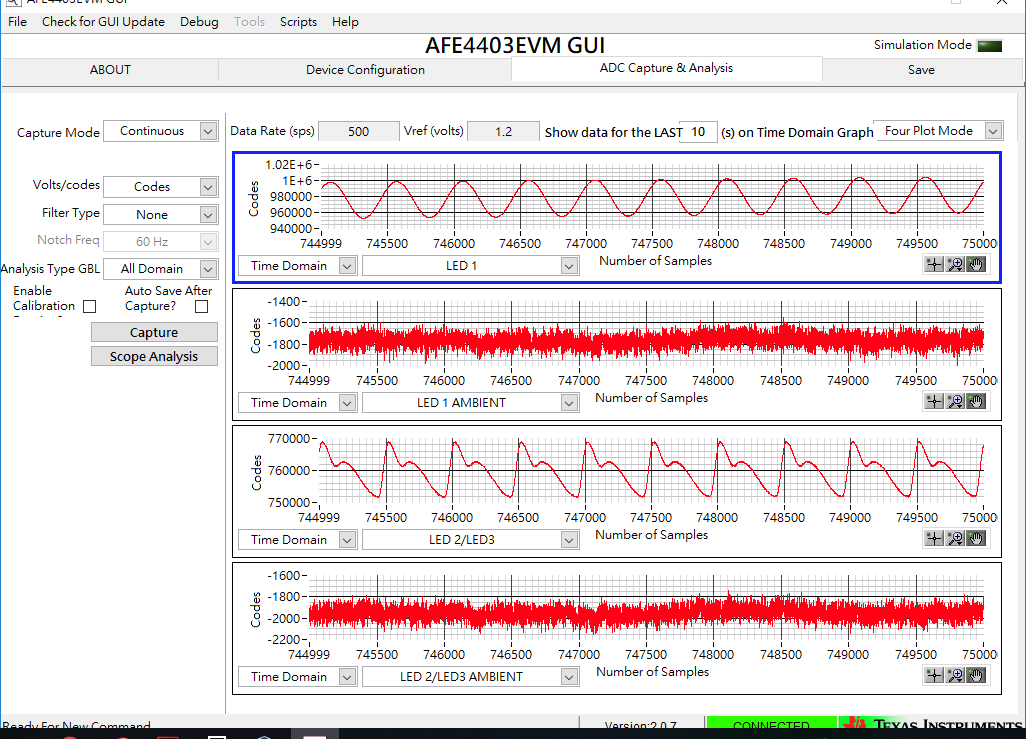
There are 4 different waveforms, from top (C1) to bottom (C4):
C1: LED 1, IR LED turn on waveform (the sample data from IR LED turn on).
C2: LED 1 Ambient, IR LED turn off waveform, in general case, this is noise only low amplitude waveform, if it is not noise waveform, means the Trigger Level is not correct or DUT sampling way is unacceptable.
C3: LED 2/LED 3, R LED turn on waveform (the sample data from R LED turn on).
C4: LED 2/LED 3 Ambient, R LED turn off waveform.